Contents
What counts as price really coming back insideWhat the trade looks like with real numbersIs this a new scenario, or are you chasing the stop you just lost?The condition that cancels the idea a second timeCheck the rules before you risk anything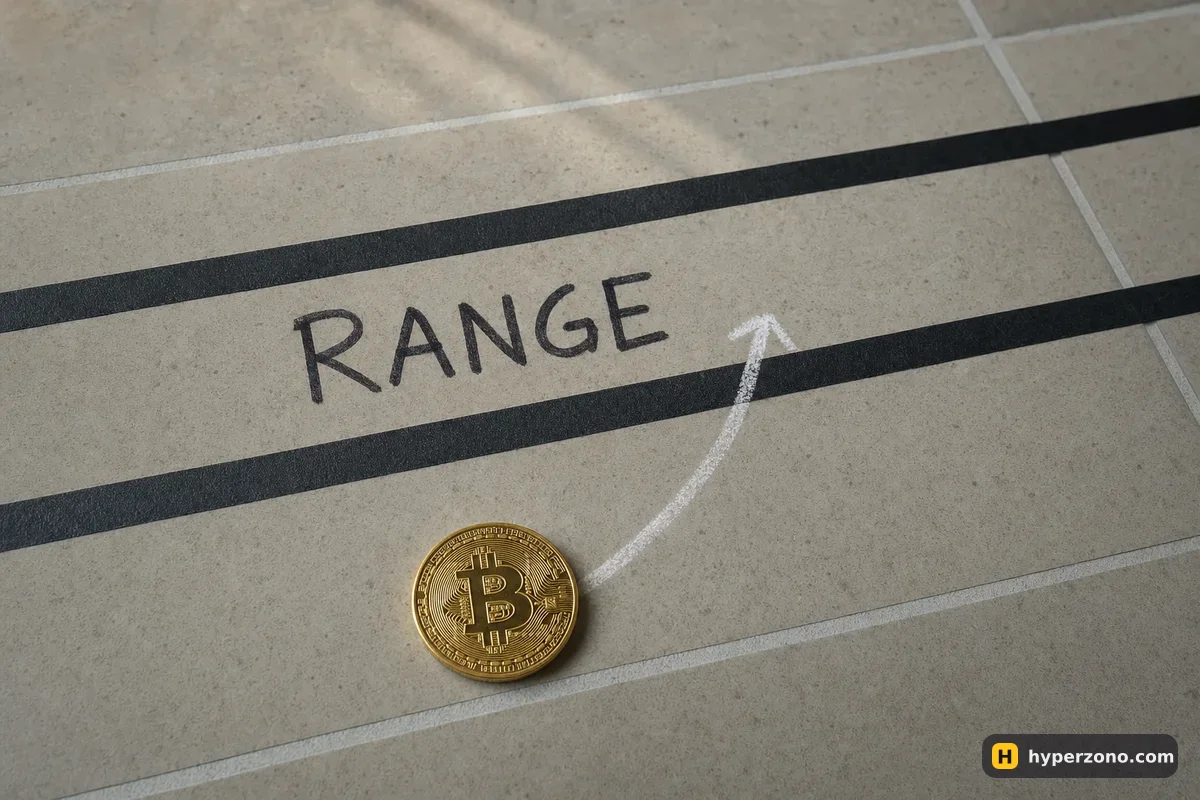
What counts as price really coming back inside
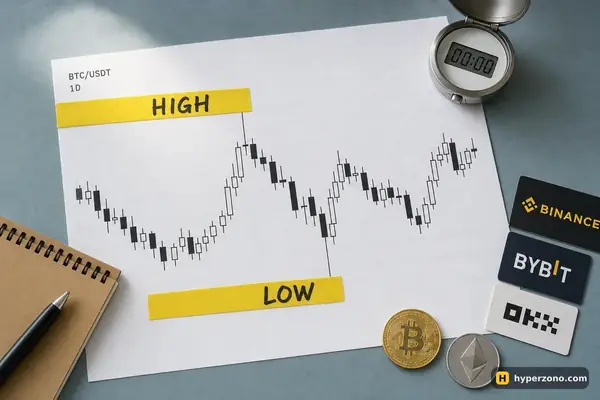
The hardest part is not the trade, it is the definition. On a live chart price often pokes below the range low for a minute and snaps back — the candle leaves only a thin line (a wick) down there, and that looks exactly like a failed breakout until it keeps going five minutes later. So write the condition the way you would explain it to someone else: which timeframe, what has to close where, and how long you give it. One workable version is "on the 1-hour chart a candle closes outside the range, and within the next three hourly candles a candle closes back inside it". Any other wording is fine, as long as a stranger reading it could point at the same candle you did.
It also helps to remember that the edge of a range is a zone, not a hairline — an area where buyers or sellers have pushed back before. In practice that means you should not treat a move of a few dollars past the low as a breakout at all, and you should not treat it as a failure either. The whole idea only exists when price made a clear, visible attempt to leave and then gave the level back.
Two related situations sit close to this one and deserve their own check: price breaking out and coming back to touch the level from the outside is a retest, not a failure, and price simply drifting sideways around the edge is neither. If you cannot tell which of the three you are looking at within a few seconds, the honest answer is to skip it. The general question of picking an approach you can repeat is covered in which futures strategy suits a beginner; here we only care about the one scenario.
What the trade looks like with real numbers
Here is an illustrative example with made-up prices, just to show the arithmetic. You have 500 USDT on your futures account and you cap the risk on one trade at 1%, so 5 USDT. Bitcoin has been moving between roughly 101,000 and 104,000 for two days. An hourly candle closes at 100,500 — below the range — and the next one closes back at 101,200, inside. That is your condition, so the idea is live: a long, with the other side of the range as the natural target.
Your stop goes below the low of the failed push, say 100,100, because if price goes back down there the whole premise is gone. That is 1,100 USDT of distance per bitcoin. Dividing your 5 USDT of risk by 1,100 gives about 0.0045 BTC, and you round down to 0.004 BTC. That position is worth about 405 USDT at the entry price, so at 5x leverage the exchange holds roughly 81 USDT of your balance as margin — your capital, your margin and your position size are three different numbers, and only the last one decides your profit.
If price works its way back to 103,800, you make 0.004 × 2,600 ≈ 10.4 USDT, minus about 0.4 USDT of fees for opening and closing (fees are charged on the 405 USDT position, not on your 81 USDT of margin). If the stop fills at 100,100, you lose about 4.4 USDT plus the same fees — call it 4.8 USDT. That is the trade: a loss you had already accepted before you clicked, and a gain roughly twice as big. If you want to try your own numbers, the position size calculator does the division for you.
Is this a new scenario, or are you chasing the stop you just lost?
This is where most of the damage happens. You went long on the breakout, price dropped straight to your stop, and now it is heading back into the range — it feels like the market owes you that money. The problem is that the urge to get the money back arrives dressed up as an insight: it feels like reading the market, not like being annoyed.
The practical test is boring and it works. Would you take this trade, at this size, with this stop, if you had never taken the breakout trade at all? If the answer is yes, take it. If the honest answer is "I want the 5 USDT back", close the app for twenty minutes. You can also make the rule mechanical: never increase size after a loss, and set a daily loss limit before the session starts so a bad hour cannot turn into a bad week.
One question before you click. Write the entry condition, the stop and the size on paper before price comes back inside. If what you are about to do differs from what you wrote even slightly — different size, closer stop, no target — you are not trading the setup, you are trading the last result.
The condition that cancels the idea a second time
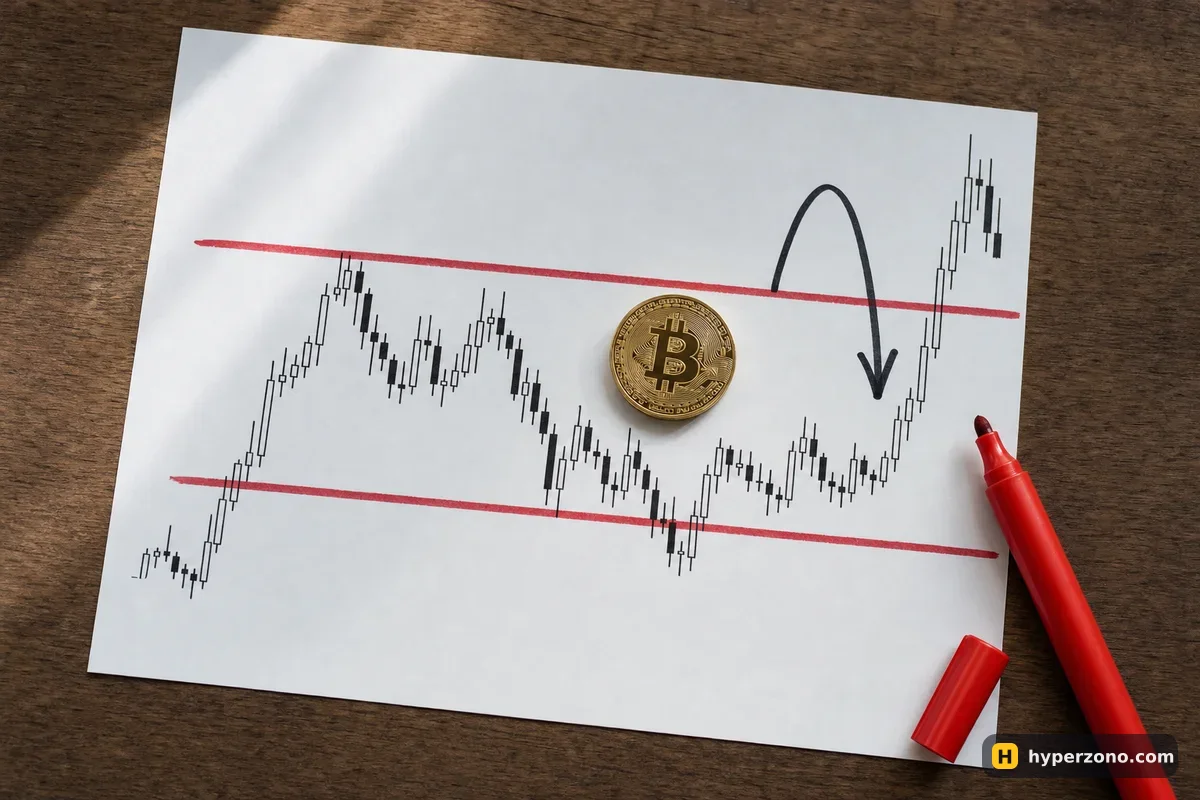
A failed breakout can fail again. Price comes back inside, you go long, and an hour later it drops straight through the range low once more and keeps going. That second move is your exit, and it should already be an order on the exchange, not a decision you make while watching. In the example above that order sits at 100,100 — below the extreme of the first attempt — because price trading there says the sellers were not finished after all. If you are new to placing it, how to set a stop loss walks through the order window.
Add a second cancel for time. If your idea was that price would travel back across the range and after six or eight hours it is still sitting within a few dollars of your entry, nothing you expected is happening. Closing a flat trade costs you a little in fees and gives you back your attention and your margin. Many traders also set a rule for the level itself: after the same edge produces two failures in a row without the move following through, drop that level for the rest of the day and look elsewhere.
One more thing worth knowing in advance: a stop is an instruction to close at market once your price is touched, so in a fast move it can fill a bit worse than the number you typed. It limits the loss, it does not freeze it exactly. That is normal, and it is one more reason the planned loss should be small enough that a slightly worse fill does not change your evening — see does a stop loss guarantee my loss for the detail.
Check the rules before you risk anything
You now have something you can actually test, because every part of it is written down: the definition of a break, the definition of a return, the stop, the target and the two cancels. Open a chart of a coin you plan to trade, scroll back a few months and walk forward candle by candle. Every time your condition appears, write down the date, where you would have entered, where the stop was and what happened next. Thirty or forty cases on paper will tell you more about this idea than thirty opinions will.
Write the rule in one sentence
Timeframe, what counts as leaving the range, what counts as coming back, and how many candles you allow.
Walk an old chart forward
Hide the right-hand side of the screen and move one candle at a time. Log each case, including the ones where you would have been stopped out.
Repeat it live without money
On a demo account the prices are real and moving, so you find out whether you can spot the condition while it forms, not only afterwards.
Then start small
If you move to real money, keep the first trades at the smallest size the contract allows, and keep the same risk per trade you used in testing.
Demo trading is the cheapest step here, because the thing you are testing is whether you can tell a confirmed return from a wick in real time. Bybit has a demo mode with real market data and play money, and opening a demo futures account on Bybit takes a few minutes; you can also simply sign up on Bybit and switch to demo before funding anything. Which products and demo contracts you see depends on where you live, so check availability in the app during sign-up rather than assuming.
Is a false breakout a reliable signal?
Nothing on a chart is reliable in the sense of always working. What a failed breakout gives you is a clear structure: a reason to enter, an obvious place for the stop just past the failed extreme, and a target on the other side of the range. That structure is what makes the idea testable, not a promise that it pays.
How long should I wait before deciding the breakout failed?
Pick a number and keep it. Something like "within three candles on my timeframe price must close back inside" works because it is checkable. If you leave it open-ended, you will eventually count a return that happened a day later, which is a different market by then.
Can I just flip my losing trade into the opposite direction?
You can press the buttons, but ask yourself whether you would open that position from a flat account with the same size and stop. If the answer is no, you are trying to recover the last loss, and the size usually creeps up when that happens. Closing the app for twenty minutes costs nothing and often saves the day.
Which timeframe works best for this?
The one you can actually watch. On a 5-minute chart these patterns appear many times a day and most of them are noise; on a 4-hour chart they are rarer and each one takes longer to resolve. Beginners usually find hourly candles a reasonable middle ground, but test it rather than taking anyone's word for it.
What if price breaks out again right after I enter?
Then your stop does its job and you are out with the small loss you planned. That is a normal outcome, not a sign the idea is broken. If the same level produces two failures in a row with nothing following through, drop it for the day and let the market settle.
Sources and fact-check
Exchange terms were checked against official documents on November 6, 2026. Terms change — before you trade, check what matters to you in the exchange app and in your contract’s specs.
Binance Academy: The Basics of Support and Resistance ExplainedBinance Academy: Trading Psychology — How to Trade Without Emotions