Contents
Why these two prices are worth marking at allFirst decide when your trading day endsMark the two lines and see where price sits nowThree scenarios to write down before anything happensWhy the level breaks more often than you'd thinkTest it on a demo chart before you risk anything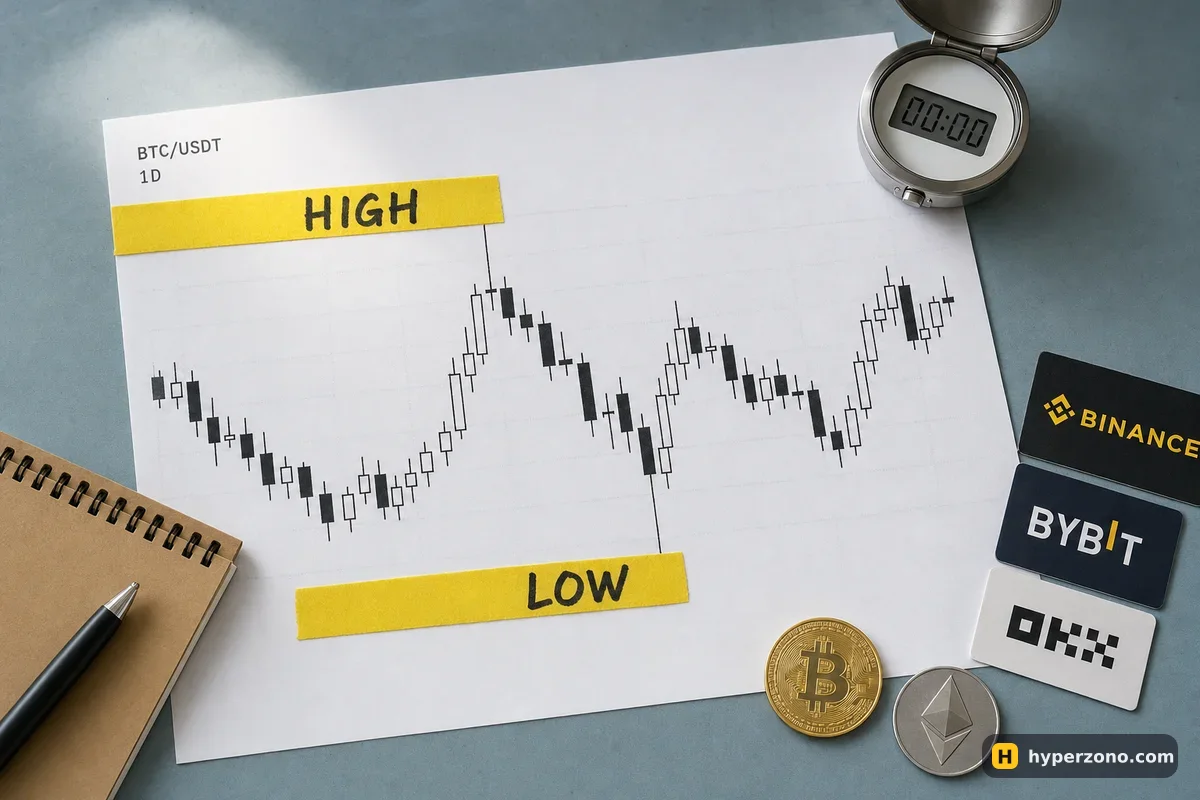
Why these two prices are worth marking at all
Yesterday's high is the price where buyers ran out of patience over a full day, and yesterday's low is where sellers ran out. Highs and lows from the daily chart tend to matter more than levels from a 5-minute chart, simply because far more people traded around them and far more people can see them. So you are not inventing anything — you are writing down the two edges the market itself produced.
The other advantage is that there is nothing to argue about. Yesterday's high is a single number, and anyone looking at the same chart with the same time zone reads the same number. That makes it one of the few chart levels you cannot quietly bend to fit the trade you already want. Our one-trade plan template asks you for an entry, a stop and a target; this page is about where those three prices come from.
First decide when your trading day ends
A share market has an opening and a closing bell, so "yesterday's high" has one obvious meaning there. Crypto futures trade through the night and through the weekend, so the daily candle has to be cut somewhere, and that somewhere is a setting in your chart, not a law of nature. Two people looking at the same bitcoin contract can see different daily highs simply because one chart is set to UTC and the other to local time.
Open your chart's settings and find the time zone it is using. Some charts open in UTC, others in your local time — look, don't assume. Either setting is fine. UTC has one small advantage: a lot of other traders are watching the same candle. If you only ever trade during your own evening, a cut-off at your local midnight may suit your routine better. What does not work is changing it halfway through the month — your old notes stop matching the chart and you lose the ability to compare one day with the next.
Write the choice down at the top of your plan in one line: "daily candles, UTC" or "daily candles, my local time". When you later look back at a trade that went wrong, you want to know exactly which two numbers you were watching that morning.
Mark the two lines and see where price sits now
Open the daily chart of one contract
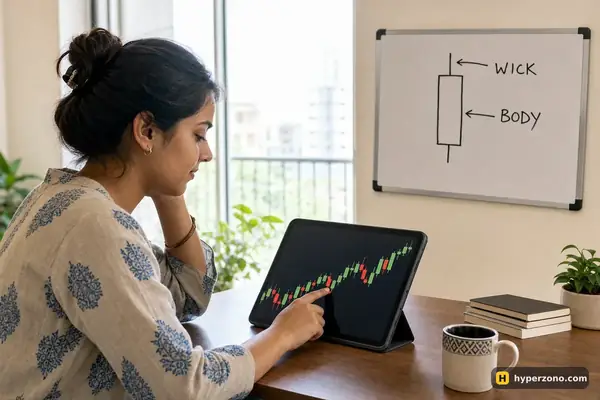
Pick a single market you plan to follow for a few weeks — most beginners use BTCUSDT or ETHUSDT. Switch the interval to one day — and note which time zone the chart is set to, because that decides where yesterday ends. You will see one candle per day, with a body and wicks above and below it.
Find the last completed candle
The candle on the far right is today, and it is still forming — ignore it. The one immediately to its left is yesterday. The tip of its upper wick is the high; the tip of its lower wick is the low.
Draw two horizontal lines
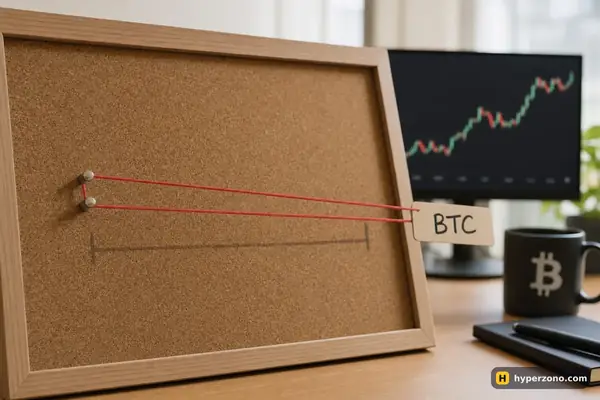
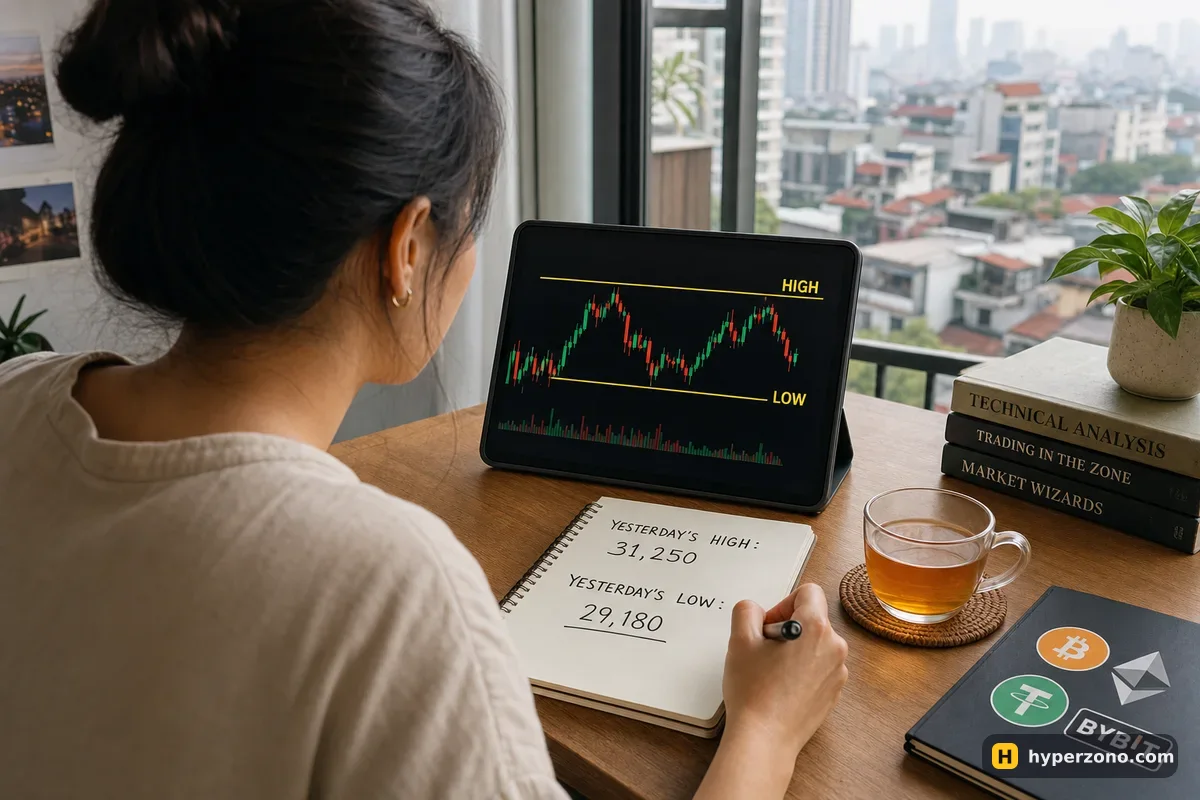
Use the chart's horizontal line tool and place one line at each price. Most charting tools let you rename a line, so label them so you can tell them apart at a glance when you are half awake.
Switch to a shorter interval and look
Move to the 1-hour or 15-minute chart. The lines stay where they are. Now there are only three possible answers: price is above both lines, below both, or somewhere between them.
Write the numbers and the gap between them
Note both prices and the distance between them in percent. That distance tells you whether a trade from one line to the other is even big enough to be worth the fees.
Here's what that looks like with made-up numbers. Say yesterday's bitcoin candle ran from a low of 105,900 to a high of 108,400. The gap is 2,500, which is about 2.4% of the price. Now put money on it: you open a 200 USDT position near the low — at 5x leverage that is 40 USDT of your own money set aside as margin. If price walks back up to 108,400, that is about 4.7 USDT of profit, and entry plus exit fees at Binance's standard taker rate of 0.05% take roughly 0.2 USDT of it. If instead the stop, sitting about 1% below the low, gets hit, you lose around 2 USDT plus those same fees. Now the question "is this worth it?" has real numbers in it, and you can answer it before you click anything.
Three scenarios to write down before anything happens
When price reaches a level like this, three things can happen: it turns away, it breaks through and carries on, or it hangs around the line for hours before picking a direction. Your plan should have an answer ready for all three, written the evening or the morning before, not invented while the candle is moving.
For a reaction, decide in advance what would convince you that buyers actually showed up at yesterday's low rather than price simply slicing through it. Many traders wait for something visible at the line — a candle with a long lower wick, or a candle that closes back above it — and only then consider an entry. If you enter right near the line, your stop can sit just beyond it, so a wrong trade costs you little, and yesterday's high becomes a natural first target. Enter far from the line and the stop has to sit much further away, so the same wrong trade costs you three or four times more money. If stops are still new to you, start with what a stop loss is and why you need one.
For a break, the question is what happens after price leaves the range. A broken low often turns into a ceiling when price comes back up to it, and a broken high often turns into a floor, so the return to the line is a second moment worth watching. Whether you act on the break itself or wait for that return is a separate decision, and we compare the two in breakout or retest entry.
The third scenario is the one beginners skip: price spends the whole session drifting in the middle, far from both lines, and there is nothing to do. Write it into the plan as a real outcome — "price between the lines and more than X away from either: no trade today" — so that doing nothing feels like following the plan instead of missing out. A day without a trade costs you nothing at all.
A level is a band, not a wire. Nothing physically stops price at an exact number, so treat each line as a small zone rather than a precise price. Allow a band of a few tenths of a percent on bitcoin, and put your stop beyond that band instead of exactly on the round-looking number everyone else can see.
Why the level breaks more often than you'd think
It will fail often enough that you need a rule for it. A rough pattern many traders notice: a level tested two to four times tends to hold up, while one that gets hit six or more times, especially in quick succession, is more likely to give way. So if price keeps poking at yesterday's high all afternoon, that is not growing proof it will hold — if anything it is the opposite.
If price closes clearly beyond your line, the reason for the trade is gone — close it or let the stop do it, and don't add more money hoping it comes back. Decide beforehand what "clearly beyond" means for you: a 15-minute or 1-hour close past the band, not a single wick that pokes through for ten seconds. Writing that sentence into the plan is what stops you negotiating with yourself while the candle is still moving.
One thing improves your odds a little: when several independent things point at the same area — yesterday's low, a level from the weekly chart, a price that has turned the market before — that area tends to be more reliable than a single line on its own. Even then price can slice straight through, which is why your stop and your position size matter more than how clean the level looks. The method's value is not that it predicts anything; it is that it gives you one consistent rule instead of a fresh opinion every morning.
Test it on a demo chart before you risk anything
Here's the cheapest way to find out whether this helps you. For the next two weeks, mark yesterday's high and low each morning on one contract and write a single line in a notebook: what price did when it reached each level — turned away, broke through, or never got there. Twenty days of that will teach you more about your market than twenty indicators, and it costs nothing but a few minutes a day.
The next step is to run the scenario with real order placement but fake money. On a demo account you can draw the two lines, place an order that waits at a price near one of them instead of buying at market — this is a limit order, and the difference is explained in market or limit order — then set the stop just beyond the line and the target at the other line, and watch what actually happens, including the part where price touches your level by a few points and never fills your order.
Our walkthrough of how to open a demo futures account on Bybit covers the setup, and if you don't have an account yet you can sign up on Bybit and switch to demo before funding anything. Check that futures and demo trading are available where you live while you register. One more thing worth repeating: demo fills and demo nerves are not the same as real ones, so treat these two weeks as a test of the method and of your own discipline, not as proof of future profit.
Should I take yesterday's high from the wick or from the close?
The wick tip is the literal highest price traded, so most people start there. Some traders prefer the highest close because it filters out one-second spikes. Pick one, note which you chose, and keep it the same for a month — then compare your notes and see which one described the market you actually trade better.
Which time zone should I set for the daily candle?
There is no official answer in crypto, because the market never closes. Check what your chart is actually using rather than assuming. UTC is a common setting and plenty of traders watch it, which is a mild argument in its favour. If you only look at charts in your own evening, local time may fit your routine better — the important part is choosing once and not switching.
Does this work on gold, oil or stock contracts on a crypto exchange?
The idea transfers, but those markets have their own rhythm: the underlying share or commodity market has real session hours even when the perpetual contract keeps trading. A "daily" high built over 24 hours of quiet weekend trading means something different from one built over a busy weekday. See do stock and index futures trade at night and on weekends before you apply it there.
Can I use yesterday's high and low on a 5-minute chart?
Yes — the lines come from the daily chart but you can view them on any interval, and that is how most people use them. The shorter chart just shows you in more detail how price approaches each line. The levels themselves never change during the day.
Do I need any indicator for this?
No. Two horizontal lines and the price itself are enough, which is the main reason this is a good first markup for a beginner. Indicators can be added later as filters, but they will not make yesterday's high a better or worse level than it already is.
What if price opens today already far above yesterday's high?
Then the range is behind you and there is no reaction to wait for at those lines. Either follow the market you have and mark the new levels as the day forms, or simply sit out — a day where your two lines are nowhere near price is a day your method has nothing to say.
Sources and fact-check
Exchange terms were checked against official documents on November 4, 2026. Terms change — before you trade, check what matters to you in the exchange app and in your contract’s specs.
Binance Academy: The Basics of Support and Resistance Explained