
Contents
What makes a strategy simple enough to actually followStrategy 1: follow the trend on the 4-hour chartStrategy 2: trade the range between support and resistanceStrategy 3: a breakout, but only after the retestWhich one should you pick first?Test one strategy for 30 trades before you judge itWhat usually goes wrong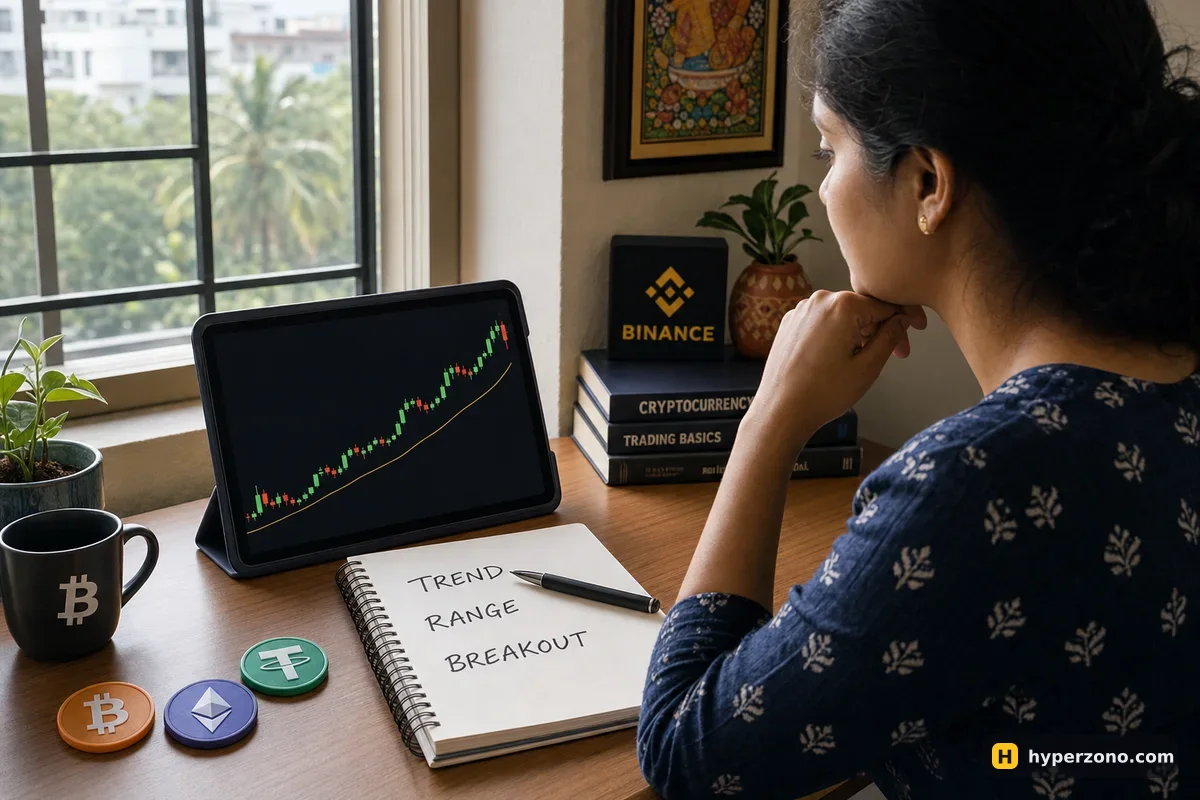
What makes a strategy simple enough to actually follow
A strategy is four answers you write down before you touch the order window: where you get in, where you get out if you are wrong, where you take the money, and what makes the whole idea dead. If you cannot say those four things out loud in ten seconds, you don't have a strategy yet — you have a feeling about the price, and that is the most expensive way to open a trade.
Everything else stays small on purpose. One pair, one chart interval, at most one indicator on the screen. Two extra lines on the chart will not save a trade that had no plan, and every extra tool is one more thing to argue with when the price moves against you.
One more rule sits above all three strategies: the same small risk on every trade. Decide that one losing trade costs you, say, 2% of your account, and let that number decide how big the position is — not how confident you feel. That calculation is covered in how much to put into one trade, so work out the size before you open the order window rather than after.
Strategy 1: follow the trend on the 4-hour chart
The idea is boring and that is its strength: you only trade in the direction the chart has already been moving for days. Open the 4-hour chart of BTCUSDT or ETHUSDT and add one moving average: a smooth line that averages the last 50 candles, so instead of the zigzag you see one direction. In the indicator list look for EMA and set the length to 50 — the exact wording differs between apps. If price is sitting above that line and each dip stops higher than the last one, you look for longs only; if it is below and each bounce fails lower, shorts only.
Your entry is a pullback. Wait until price comes back down close to the line. Then watch the 4-hour candles: when one of them closes higher than it opened and price turns back up, that is your entry. The stop goes below the last low made before that pullback, the target is at least twice the distance from entry to stop, and the idea is dead — your invalidation — when a 4-hour candle closes clearly on the wrong side of the line. Then you stand aside and wait for a new trend to form.
Here is one illustrative set of numbers so the sizing is clear. Say you have 200 USDT and you risk 2% of it, so 4 USDT on this trade. You want to go long at 100,000 with the stop at 97,000 — that is 3% away, so a position of about 130 USDT of value loses roughly 4 USDT if the stop is hit, and makes about 8 USDT at a target of 106,000. Note that 130 USDT of position on a 200 USDT account means you are not even using leverage — your own money covers it, and what leverage a beginner should use is the next question once the rules feel comfortable. Yes, 8 USDT is a small gain. That is the point: with this size a run of losing trades costs you a few dollars, and you still have an account left when your rules finally start working.
Strategy 2: trade the range between support and resistance
Most of the time price is not trending at all. It bounces between a floor and a ceiling for days, and traders who keep buying breakouts in that kind of market slowly bleed. Mark the two flat levels where price has turned at least twice on the 4-hour chart, then drop to the 1-hour chart to place your trades. Those two lines are your whole strategy: buy near the floor, sell near the ceiling, nothing in the middle.
For a long, put a limit order a little above the floor and let price come to you instead of chasing it. Put the stop just beyond the level, far enough that a quick spike through it — the thin line that sticks out of a candle — doesn't close you out for nothing. Take profit at the other side of the range, or in the middle if you like locking money in early. And if a 1-hour or 4-hour candle closes outside the range, the range is over — cancel your orders and walk away.
A short is the same thing mirrored: the limit order sits a little below the ceiling, the stop goes just above it, and the target is the floor. Do this on the big coins — bitcoin and ethereum. Small coins jump straight through levels, which turns a careful stop into a lottery ticket.
Strategy 3: a breakout, but only after the retest
When a quiet range finally breaks, the move can be fast — and that is why so many beginners jump in at the worst possible price. Plenty of breakouts come straight back inside the range an hour later and stop out everyone who chased. Waiting for the retest filters out a part of those false moves: not all of them, but it keeps you out of a good number of the trades that reverse within the hour.
So a 4-hour candle closes beyond the level, and then you do nothing. You wait for price to come back to the broken level and hold there — a candle that touches the old ceiling from above and closes back up is your entry signal. The stop goes a little back inside the old range, because if price is in there again the breakout failed. The target is the height of the range measured from the broken level. If price closes back inside the range instead, the trade never existed; if the retest never comes, you skip it and keep your money. Skipping is a valid outcome.
Which one should you pick first?
Look at your chart right now and let it choose. Clear steps up or down for several days mean trend. A flat corridor with two obvious turning points means range. A long quiet stretch that has just snapped means breakout with retest. Run one of them for a month, and only add a second when the first one is dull and automatic. Running three at once means you will blame the wrong one when the account shrinks.
| Strategy | When it fits | Entry trigger | Where the stop goes |
|---|---|---|---|
| Trend on 4h | Price makes higher lows (or lower highs) for days | Pullback to the moving average, then a 4h candle closing back with the trend | Beyond the last swing low or high |
| Range | Price turns at the same two levels at least twice | Limit order near the level, facing back into the range | A little beyond the level |
| Breakout + retest | A long quiet range that finally breaks | Price returns to the broken level and holds it | Just back inside the old range |
All three can be automated later, and a grid or signal bot is really just someone else's rule set running while you sleep. Learn to place these trades by hand first, otherwise you will not be able to tell a bot having a bad week from a bot that was never going to work.
Test one strategy for 30 trades before you judge it
Three trades tell you nothing. Any set of rules can win three times by luck or lose three times in a flat market. Around 30 trades is where a pattern starts to show, and the cheapest place to collect them is demo mode, where the charts are real and the money is not. You can sign up on Bybit and switch to demo trading in a couple of minutes — during sign-up the app will show you whether futures are available where you live.
Demo won't tell you everything — your orders fill a bit differently with real money, and your hands shake in a way they never do on demo. That's why the first real trades stay small. More on that in how demo differs from the real thing.
If Bybit is the exchange you picked, the screen-by-screen walkthrough is in how to open a demo futures account. Once the demo account is open, the routine below is what turns practice time into a real answer about your strategy.
Write the rules on one page
Pair, chart interval, entry trigger, stop, target, invalidation. If it doesn't fit on one page, it is too complicated for trade number 20 at midnight.
Fix your risk per trade
Same percentage every time — 1% or 2% of the account. No bigger size because this one 'looks obvious'.
Open demo and trade only those rules
Switch the exchange app to demo mode and take the setups your page describes. Nothing else gets touched.
Log every trade in a notebook
Date, long or short, entry, stop, target, result, and one honest column: did I follow my rules, yes or no.
Review after 30 trades
Count how many followed the rules, the total result, and your average win compared with your average loss. A strategy that wins 4 times out of 10 can still be fine if the wins are twice the size of the losses.
Go live small
Only if most of those 30 trades followed the rules. Start with an amount you can lose without changing anything in your life.
Trades where you broke your own rules don't count as data. If you moved the stop, entered early or doubled the size, that trade tells you nothing about the strategy — it tells you something about your discipline. Mark it in the log and keep collecting the clean ones.
What usually goes wrong
The strategy is rarely the problem. The stop gets moved further away because the loss feels unfair, the next position is doubled to win the money back, and leverage gets raised because 2% a trade is 'too slow'. Each of those decisions is made in a few seconds and undoes a month of patient work. A stop placed before you enter, and left alone, is the one habit that protects everything else — see what a stop loss is and why you need one if you have not set one yet.
The other common failure is boredom. A trend strategy on the 4-hour chart may give you two or three signals a week, and that silence pushes people into trades their rules never allowed. There is no bonus for trading often. Write the quiet days into your log as skipped days and come back when the chart gives you something your rules recognise.
What is the easiest crypto futures strategy for a beginner?
Trend following on the 4-hour chart, because it needs one indicator and only a few decisions a week. You trade in the direction price has already been moving, put the stop beyond the last turning point, and aim for roughly twice what you risk. Easy to describe does not mean easy to follow — the hard part is sitting out the days with no signal.
How many indicators do I need for these strategies?
One is enough, and zero is fine for the range and breakout setups, since those use horizontal lines you draw yourself. A chart covered in indicators mostly gives you more reasons to argue with your own stop loss.
Which coins and timeframes work best for a beginner strategy?
Bitcoin and Ethereum perpetuals, on the 4-hour chart for the picture and the 1-hour for entries. They move enough to pay for the trade and they rarely jump wildly through your levels the way tiny altcoins do.
Can I use the same strategy for both long and short trades?
Yes, all three work mirrored. In a downtrend you sell the bounces instead of buying the dips, and your stop goes above the last high instead of below the last low. The rules are the same; only the direction flips.
What should I do after five losing trades in a row?
Stop trading for a day and read your log. If all five followed your rules, this is a normal losing streak and your risk per trade is doing its job. If two or three of them broke the rules, the strategy was never tested — go back to demo and finish the 30 clean trades.
Is it not easier to just follow signals from a Telegram channel?
It feels easier, until a signal arrives with no stop and no reason you can check. With your own rules you always know why you are in a trade and when to leave it, which is the only thing that improves over time.