Contents
Equal price step or equal percentage stepThe same range, two sets of levelsWhat changes in your fills and your cycle profitHow to choose on purpose instead of guessing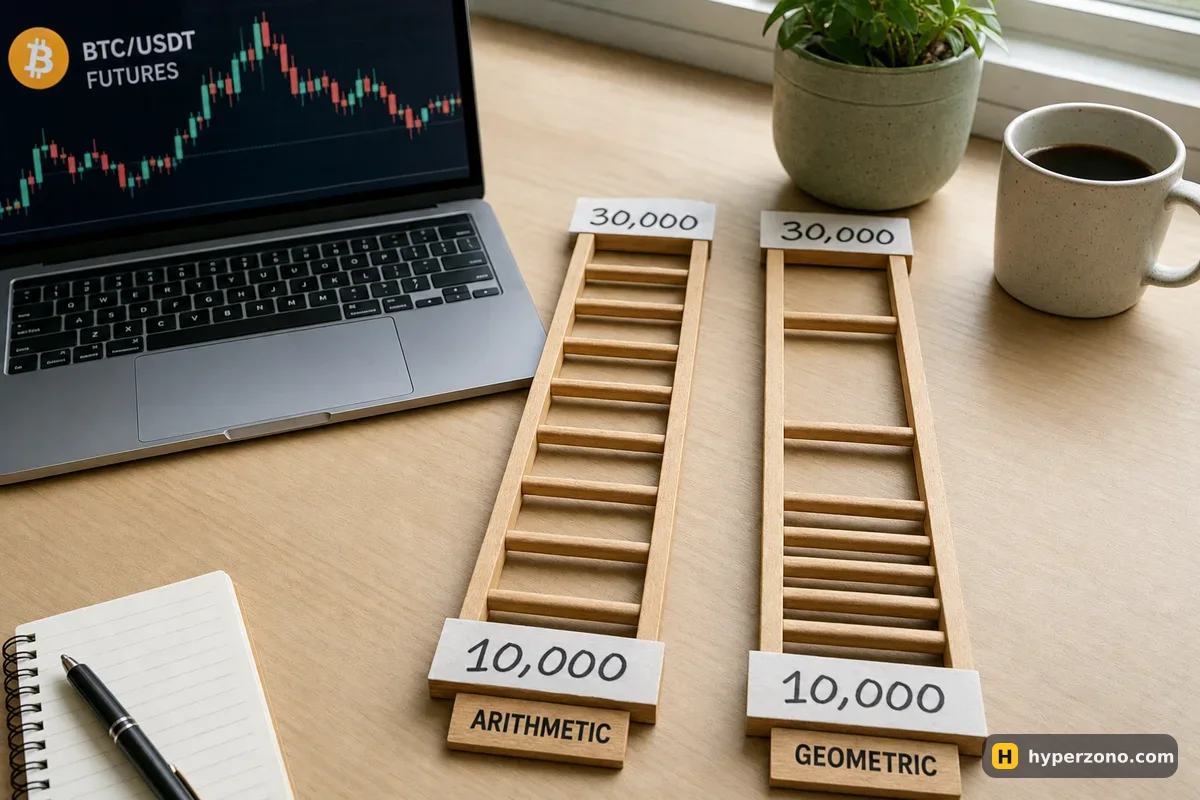
Equal price step or equal percentage step
Arithmetic means every gap is the same number of USDT. The exchange takes your range, subtracts the lower price from the upper one and divides by the number of grids. For a range of 10,000 to 30,000 with 5 grids that is (30,000 − 10,000) ÷ 5 = 4,000 USDT between each pair of neighbouring levels, all the way up.
Geometric means every gap is the same percentage. Here the exchange divides the upper price by the lower one and takes the fifth root: (30,000 / 10,000)^(1/5) − 1 ≈ 24.57%. Each level sits 24.57% above the one below it, so the gap in dollars starts small at the bottom and grows as price rises. These are the two formulas Bybit shows in its own futures grid examples, and the names you will see in the bot form are usually exactly these two words.
Everything else about the bot stays the same: it still places buy orders below and sell orders above, still closes a cycle when a pair of orders fills, and still does nothing outside your range. If that part is new to you, the mechanics are laid out in our guide to how a futures grid bot works — this page is only about where the lines land.
The same range, two sets of levels
Take one practice setup and run both modes on it: BTCUSDT, lower bound 10,000, upper bound 30,000, 5 grids. Six price lines in total — the two bounds plus four lines in between. The arithmetic column climbs by a flat 4,000 every time, so it needs no step column of its own; the geometric one is worth watching.
| Line | Arithmetic price | Geometric price | Geometric step |
|---|---|---|---|
| Lower bound | 10,000 | 10,000 | — |
| 2nd | 14,000 | 12,457 | +2,457 |
| 3rd | 18,000 | 15,518 | +3,061 |
| 4th | 22,000 | 19,331 | +3,813 |
| 5th | 26,000 | 24,082 | +4,751 |
| Upper bound | 30,000 | 30,000 | +5,918 |
Look at the lower half of the range, from 10,000 to 20,000. The arithmetic grid puts three lines there (10,000, 14,000, 18,000). The geometric grid puts four (10,000, 12,457, 15,518, 19,331). That is the whole practical difference in one sentence: geometric crowds its levels toward the bottom of the range, arithmetic spreads them evenly in dollars, which in percentage terms means they bunch up at the top.
Now read the same prices in percent, measuring each gap from the line below it. The gap from 10,000 up to 14,000 is 40% of the lower price; the gap from 26,000 up to 30,000 is only 15.4% of its lower price, even though both are 4,000 USDT. The geometric grid makes every gap the same 24.57%, high or low. Where the buy and sell orders sit relative to the market price is a different setting (Long, Short or Neutral) — the spacing rule only decides the price lines themselves.
What changes in your fills and your cycle profit
A grid cycle ends when the bot buys at one line and sells at the line above (or the other way round in a short grid). The cash you collect is the gap between those two lines multiplied by the quantity traded there, minus the fee on both executions. Say the bot trades 0.01 BTC at each line. Then every arithmetic cycle brings 4,000 × 0.01 = 40 USDT before fees, wherever it happens. The geometric bot brings about 24.57 USDT on the lowest cycle and about 59.18 USDT on the highest one.
The fee works the other way round: it is charged on the value of each execution, so the same 0.01 BTC costs more to trade at 24,082 than at 10,000. The grid's levels wait in the order book, so they usually fill as maker — 0.02% at Bybit's base level, against 0.055% if an order fills as a taker.
Put that in money. On the lowest geometric cycle you gain 24.57 USDT and pay about 0.045 USDT in fees for the buy and the sell together, so almost all of it stays with you. Now picture a tight range where each step is only 0.2%: the same 0.01 BTC bought at 10,000 and sold 20 USDT higher pays 0.20 USDT, and the two fees eat about 0.04 of that — a fifth of the gain. The rule of thumb is simple: if your smallest step in percent is not comfortably bigger than what you pay to enter and exit, that level is working for the exchange, not for you. Put your range, grid count and fee into the calculator below and look at what one closed cycle is left with.
Two things stay identical whichever mode you pick. More grids inside the same range means smaller steps, more frequent fills and less money per fill, with a fee charged every time; fewer grids means rarer, bigger cycles. And the profit from closed cycles is not your total result — the open position the bot is carrying, plus funding, belongs in the same sum. If a bot ever shows green cycle profit and a red total, that page explains where the money went.
How to choose on purpose instead of guessing
Measure your range in percent
Divide your upper bound by your lower bound. If the answer is close to 1 — say a 95,000–105,000 range on bitcoin, about 1.11 — the two layouts will differ by a few dollars per level and the choice hardly matters. The 3x range in the example above is deliberately extreme so you can see the mechanism.
Decide which half you want denser
If you expect most of the back-and-forth to happen in the lower part of your range, geometric gives you more lines down there. If you want the same cash result from every completed cycle regardless of price, arithmetic does that.
Check the step against your costs
Write down the smallest step your grid will have in percent and compare it with the round trip — about 0.04% if both fills are maker at Bybit's base rate, plus whatever slippage you see. A 1% step is far bigger than that and keeps nearly all of each cycle; a 0.1% step hands back close to half of it before you count funding.
Write the setting down and keep it
Note the mode, range, grid count and amount before you start. If you change the mode on your next run, change only that, so the comparison means something. Our first bot walkthrough covers the rest of the form.
The quickest way to make this concrete is to fill in the grid form with your own numbers and look at the level preview before you commit anything: open the bot section on Bybit, set the same range in both modes, and compare the list of order prices with the table above. Reading the preview is free; funding the bot is a separate decision for another day. Which bot type fits you at all is a different question, and we walk through it in how to choose a bot.
The grid only lives inside your range. Bybit states that above the upper bound and below the lower bound the bot places no new orders until price comes back. You can wait or end the strategy — and if you end it, pending orders are cancelled, positions are closed at market price and the assets go to your Funding Account. That behaviour is the same in both modes, so it is the range itself, not the spacing rule, that decides how often your bot sits idle.
Which grid type is better for a beginner?
Neither one is safer by itself — they place the same number of orders between the same two prices. For a narrow range the difference is a few dollars per level and you can pick either. The useful habit is to choose one, write it down, and keep it for a few runs so that when something changes in your result you know it was not the spacing.
Does a geometric grid make more money than an arithmetic one?
It does not add profit, it moves it around. Geometric gives every cycle the same percentage gap, so cash profit per cycle grows with price; arithmetic gives every cycle the same cash gap, which is a bigger percentage down low and a smaller one up high. What you actually end up with depends on where price spends its time, your fees and funding.
Do grid orders pay the maker or the taker fee?
The levels sit in the order book waiting to be hit, so they usually fill as maker, which is 0.02% at Bybit's base level against 0.055% for a taker fill. Some executions can still land as taker — the order that opens the starting position, for example, or a market close when you stop the bot. Your own rate is shown on the fee page in your account after verification.
Can I switch the grid type after the bot is running?
The grid type is part of the setup, not a toggle you flip mid-run, so in practice you stop the bot and create a new one. Keep in mind what stopping does: on Bybit the pending orders are cancelled and open positions are closed at market price, which means the switch itself has a cost. Check what your app shows before you confirm.
Why does my bot show fewer orders than grid lines?
A grid with 5 grids has 6 price lines, but you will usually see fewer orders than lines: in Bybit's geometric example nothing sits at 19,331, the line closest to the market price of 19,000, while the rest are split into buys below and sells above. Check what your own app shows after you create the bot. There is a separate page on the order count.
Is a 10,000 to 30,000 range on bitcoin realistic?
It is a teaching range from the exchange's own documentation, chosen so the two layouts look clearly different. Real ranges are usually much tighter — a few percent to a few tens of percent — and at that width arithmetic and geometric levels end up only a short distance apart.
Sources and fact-check
Exchange terms were checked against official documents on November 11, 2026. Terms change — before you trade, check what matters to you in the exchange app and in your contract’s specs.
Bybit: Introduction to Futures Grid Bot on BybitBinance: What Is Futures Grid Trading?