Contents
Why 100,000 looks like a wallCompare the number with the real reactions on your chartWhat the orders around the number are telling youWhen the level breaks and price never comes backMark one chart, then test it with no money at riskWhy 100,000 looks like a wall
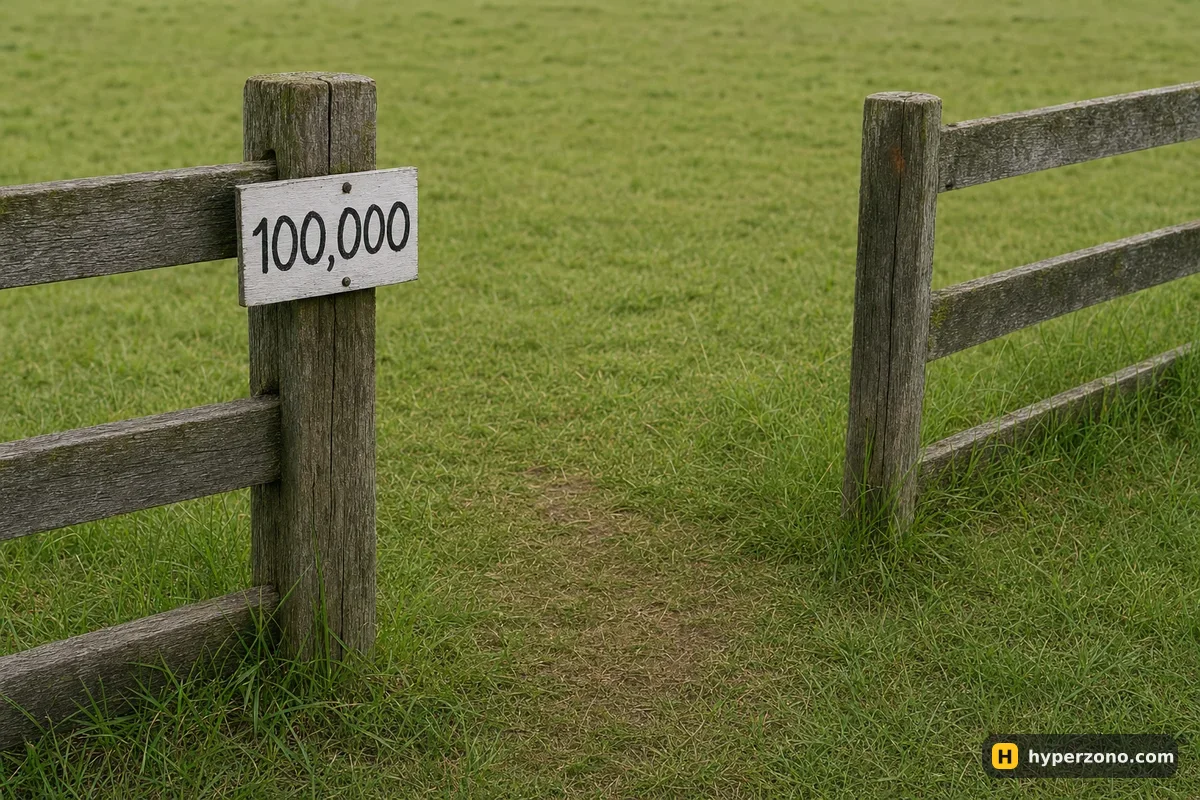
People round their numbers. Nobody puts a buy order at 99,847 — they put it at 100,000, and nobody sets a target at 48,763 when 50,000 is right there. That habit is the whole reason the level exists: thousands of orders pile up around the same tidy figure, so when price gets there it meets more buying and selling than it met two hundred dollars earlier.
There is nothing in the market that makes price stop at a round figure — no rule, no mechanism, just the crowd's orders. So when Bitcoin reaches 100,000, expect something to happen there, and decide in advance what you will do if it bounces and what you will do if it goes straight through. That one decision turns the number from a hope into something you can actually trade around.
Compare the number with the real reactions on your chart
This takes about fifteen minutes and it is the part most people skip. Open a daily chart of the coin you follow, draw one horizontal line on the round number, scroll back a year and look at every visit to that line. Only three things can happen when price arrives: it turns around, it carries straight on toward the next big figure, or it moves sideways for a while before picking a direction. You are simply counting how many of each you find.
Draw the line, then widen it into a band
Put the line on the round figure, then add a line a small distance either side — about 0.5% on Bitcoin, so 99,500 and 100,500 around 100,000. Now you have a band instead of a hairline, and that band is what you measure against.
Mark every visit
Scroll back and tag each time price entered the band. Write next to each one: turned, went through, or went sideways. No interpretation yet, just the three labels.
Note where the turn actually started
If price turned, did it turn inside the band or several hundred dollars before it? Plenty of traders know the round-number habit and deliberately put their orders slightly in front of the figure to get filled first, which often drags the reversal forward and leaves the exact number untouched.
Count how many times it has been tested
A band that has held two or three times still has plenty of resting orders behind it. One that price has hit six or seven times in a few weeks has had most of those orders filled already, and it usually gives way sooner than people expect.
What usually comes out of this exercise is less dramatic than the belief you started with. You find a couple of clean turns, one or two times when price went straight through, and a long sideways stretch where the number meant nothing for a week. That is the honest picture, and it beats a feeling. If your chart is cluttered with lines already, there is a separate page on picking support and resistance levels, and the wider question of timing is covered in when to buy and when to sell.
What the orders around the number are telling you
The order book is just a live list of the buy and sell orders waiting at each price, and near a famous figure those lists get thicker. Large traders know that, and they go where the orders are, because that is the only place they can buy or sell a big amount without moving the price far away from where they started.
Here's the catch: the same pile of orders supports two completely opposite stories. A wall of buy orders under 100,000 can soak up the selling and turn price around — or it can be exactly what one big seller needed in order to get filled, and once those buyers are used up price drops straight through. You know where the crowd is standing. You still don't know which way it moves, so you need both answers ready before price gets there.
That also tells you where not to put your stop. Sitting exactly on the round figure puts it in the noisiest spot on the chart, where price often moves through by a few dollars and comes back. Put it a little beyond the band instead, so a genuine break ends the trade and ordinary wobbling around the number does not — the same idea the stop-loss basics page keeps coming back to: place it where your idea is wrong, not where it feels comfortable.
When the level breaks and price never comes back
Picture an illustrative case on Bitcoin. Price has been moving slowly around 100,000 for a week, you are waiting for the bounce, and instead a daily candle closes at 98,800 — well under the lower edge of your band. Two days later price climbs back to 99,500, that same lower edge, stalls there and turns down again. The number is still doing its job; it has simply swapped sides, and what used to hold price up is now capping every attempt to rise.
Say you bought the "it has to hold" idea with no stop. You opened 500 USDT at 5x, so 100 USDT of your own money is tied up as margin. A 1% drop costs 5 USDT, a 5% drop costs 25 USDT — a quarter of the margin you put in, for a level that never promised anything. The fees are the small part: at Bybit's base taker rate of 0.055%, opening and closing 500 USDT comes to about 0.55 USDT in total. It is the move you did nothing about that hurts.
Write the trigger before you watch the price. Decide in advance what would count as proof that buyers actually showed up — for example a candle that pushes down into the band and then closes back above it, instead of just touching the number. Write where your stop goes, just beyond the band, and what counts as a break that cancels the whole idea. If your trigger never appears and price goes straight through, you skip the trade and lose nothing.
One thing genuinely improves your odds, without promising anything: several reasons landing in the same place. A round number sitting on its own is the thinnest version of the idea. When an old high, a moving average — the line that shows the average price of the last 50 or 200 days — that price has turned at several times before, and the round number all sit within a few hundred dollars of each other, more people are watching that spot and more orders rest there, though price can still go through it. Levels you can see on a daily or weekly chart carry more weight than ones that only exist on a 5-minute chart.
Mark one chart, then test it with no money at risk
The honest way to settle this is to run it forward instead of arguing about it. Pick one coin, mark the nearest round number as a band, and write a one-line plan for the next approach: what you need to see, where the stop goes, what makes you stand aside. Then watch the next five visits and record what happened, whether you traded or not. You can do the whole thing without risking money.
Bybit has a demo mode with practice money — when you sign up on Bybit, look for the demo switch in the app and check the contract you want is there. Check during sign-up that Bybit and its futures are available where you live; the list of countries changes. Demo will not copy the feeling of real money or the exact fill you would get, but for finding out whether a level deserves your trust it is enough.
Do round numbers actually work in crypto trading?
They matter because orders cluster near them, and that clustering is real. But nobody can give you a success rate, and any percentage you see quoted is somebody's guess. Count the reactions on your own chart over the last year and you will have a far better answer than any general claim.
Why does price often turn just before the round number?
Because the habit is so well known that traders put their orders slightly in front of the figure to get filled first. All that buying lands at 99,700 rather than 100,000, so the turn happens before price ever touches the number. That is exactly why a band works better than a single line.
Should I put my stop-loss exactly on the round number?
That is the most crowded spot on the chart, where price often moves through by a few dollars and comes straight back. Put it a little beyond the band, so a real break takes you out but normal noise around the figure does not. How far beyond depends on how much the coin moves in a day and on the loss you decided to accept for that trade.
What if price breaks the level and then comes back to it?
That return tells you something. If the old floor now stops every attempt to climb back, the level has flipped and your long idea is finished. There is a separate page comparing entering on the break versus waiting for the pullback if you want to plan both.
Is a round number enough on its own to open a trade?
It is the weakest version of a level. When an old high and the round number sit in the same place, more people are watching and more orders rest there — and even then price breaks through regularly. Treat the number as one piece of evidence, keep the position small, and put the stop where your idea is proven wrong.
Sources and fact-check
Exchange terms were checked against official documents on November 4, 2026. Terms change — before you trade, check what matters to you in the exchange app and in your contract’s specs.
Binance Academy: The Basics of Support and Resistance ExplainedBinance Academy: What Is an Order Book and How Does It Work?