
Contents
What a timeframe actually isWhy 1m and 5m charts are the hardest place to beginMatch the chart to the hours you can actually watchUse two charts: 4h for the direction, 1h for the entryHow the timeframe changes your stop and what you pay to hold the tradeHow to set it up in the app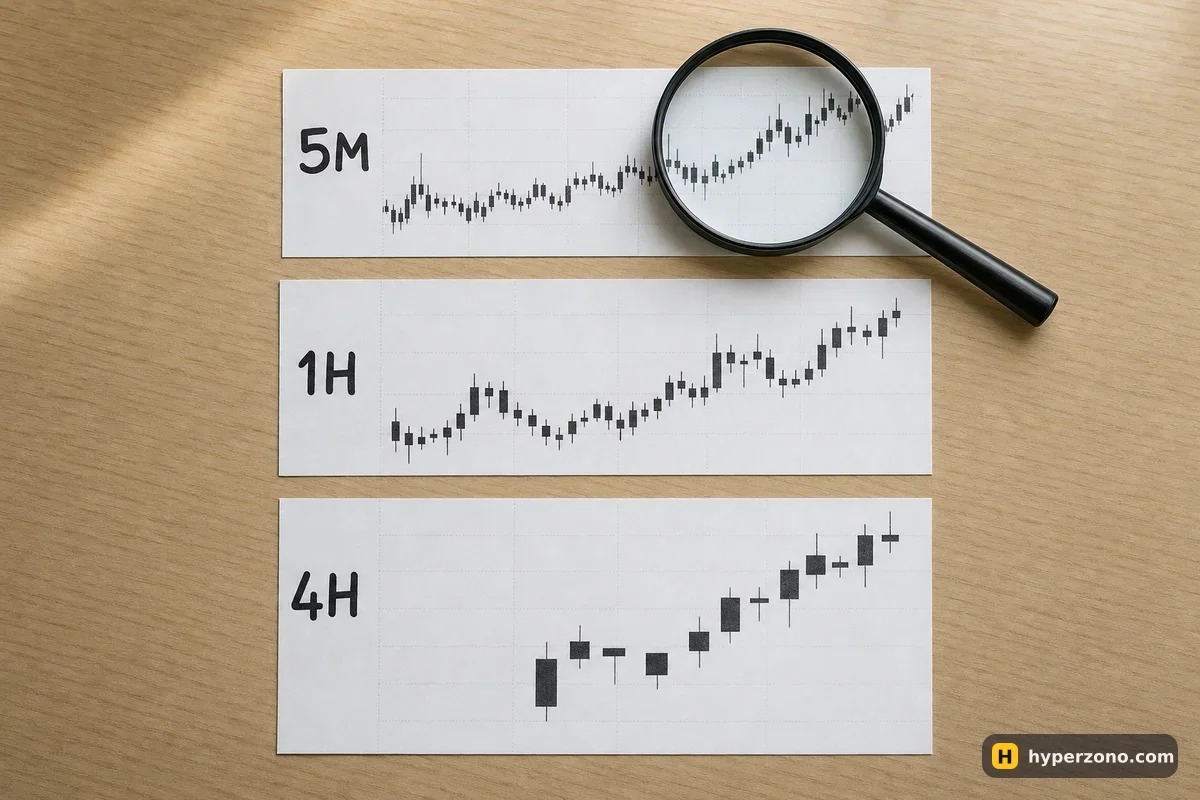
What a timeframe actually is
Open any chart on an exchange and you will see a row of buttons: 1m, 5m, 15m, 1H, 4H, 1D. That is the timeframe selector, and it changes one thing — how much time each candle on the screen covers. On the 1-hour chart, every candle is one hour of trading: where the price opened, how high and low it went, where it closed when the hour ended.
So one day of bitcoin's price is 1,440 candles on the 1-minute chart, 288 on the 5-minute, 24 on the 1-hour, 6 on the 4-hour and a single candle on the daily. The price is exactly the same — you are only choosing how zoomed in you want to be. If you are not sure yet how to read the candles themselves, that is a separate short lesson in how to read a candlestick chart.
Why 1m and 5m charts are the hardest place to begin
On a 1-minute chart the price jumps around constantly, and almost none of those jumps mean anything. A new candle appears every sixty seconds, each one begging you to do something, and you end up opening and closing trades because you are bored rather than because you had a reason.
There is a money side to it too. Every trade costs a fee on the way in and on the way out, so ten small trades a day cost ten times what one trade costs — and on a fast chart your profit target is small, which means the fees take a much bigger bite out of it. Fast charts also force you to decide in seconds, which is exactly when beginners move the stop further away, add more money to a losing trade, and turn a small loss into a big one.
Match the chart to the hours you can actually watch
The honest way to pick an interval is to start from your day, not from the chart. If you can only look at your phone before work and again in the evening, a 5-minute chart is useless to you — the move you wanted will have come and gone twelve times before you next look. Pick a timeframe slow enough that nothing important happens between your check-ins.
| When you can look at the chart | Interval to use | How long a trade tends to last |
|---|---|---|
| Twice a day, a few minutes each | 4h for direction, 1h for the entry | A day to a few days |
| One focused hour or two in the evening | 1h, with a glance at 4h | Several hours to a day |
| Almost never, you just want a plan | 1D for direction, 4h for the entry | Days to a week |
Notice that none of these rows needs you in front of a screen all day. A stop-loss and a take-profit do the watching for you, which is why a slower chart and a plan go together. How much time futures really take in total is covered in how much time per day futures trading takes.
Use two charts: 4h for the direction, 1h for the entry
You do not need five charts. The version that works for most beginners is two: the 4-hour chart tells you the direction, the 1-hour chart tells you where to get in. Look at 4h first and answer one question in plain words — is the price generally climbing, generally falling, or just moving sideways in a range?
If 4h is climbing, you only look for longs on the 1-hour chart. If it is falling, you only look for shorts. If it is going sideways with no clear direction, the best answer is often to skip it and check again tomorrow. That single filter removes most of the trades beginners regret, and it pairs naturally with a written plan for the trade before you press the button.
How the timeframe changes your stop and what you pay to hold the trade
A slower chart means wider swings, so your stop-loss has to sit further from your entry — maybe 2% away on a 1-hour trade instead of 0.4% on a 5-minute one. That does not mean you risk more money. It means you take a smaller position.
Here is what that looks like with round numbers. With 100 USDT in the account, if you open a 100 USDT position and your stop sits 2% away, the loss is 2 USDT. If your stop is only 0.4% away, you could open a 500 USDT position for the same 2 USDT of risk. You change the position size, never the amount you are willing to lose.
Holding longer also means living with funding — the small payment that longs and shorts exchange at set times on perpetual contracts, often every eight hours. A trade you close within an hour may never touch it; a trade you hold for three days will pay or receive it several times. Usually it is small, but you should know it is there before you fall asleep with a position open.
Pick one pair of intervals and stay with it. Jumping between 5m, 15m and 1h to find a chart that agrees with you is how beginners talk themselves into bad trades. Choose 4h plus 1h, use it for twenty trades, and only then decide whether it suits you.
How to set it up in the app
Open the chart for one coin
Start with a large, liquid coin — bitcoin or ethereum. The reasons are in which coins to trade first.
Tap the interval selector
It is the row or dropdown at the top of the chart showing 1m, 5m, 15m, 1H, 4H, 1D. Choose 4H and look at the last few weeks.
Write the direction down
One word on a note: up, down or sideways. Do this before you look at anything else, so the fast chart cannot change your mind.
Switch to 1H and find your entry
Look for a price level where you would be happy to enter, and decide in advance where your stop goes — see how to set a stop loss.
Try it with no money first
Both of these steps work the same in demo mode, so you can practise the routine before a single dollar is at risk. You can sign up on Bybit and switch the account to demo — during sign-up the exchange will show you whether futures are available where you live.
Once the two-chart routine feels automatic, the next question is what you actually trade with it — that is the ground covered in strategies that suit beginners.
What timeframe should a beginner use for crypto futures?
The 1-hour chart for entries and the 4-hour chart for direction suits most people starting out. It is slow enough that you are not glued to your phone, and fast enough that a trade finishes within a day or two instead of a month.
Is the 1h or 4h chart better for trading?
They do different jobs, so you use both. The 4-hour chart answers 'which way is this market generally going', the 1-hour chart answers 'where do I get in and where does my stop go'. If the two disagree, the 4-hour one wins and you wait.
Can I trade futures on the 5-minute chart?
You can, and plenty of experienced traders do. But you will take many more trades, pay fees on every one of them and have seconds rather than hours to make each decision. It is a much harder way to learn, so leave it until the slower charts feel comfortable.
Does the timeframe change how much leverage I should use?
Not directly, but it changes your stop distance, and the stop distance decides your position size. A wider stop on a 4-hour trade simply means a smaller position, so the money you risk stays the same.
Do I have to sit and watch a 4-hour candle form?
No, and that is the point of a slower chart. You set your stop-loss and take-profit when you open the trade, then check in once or twice a day. The exchange keeps watching the price while you are at work or asleep.
Which timeframe shows the 'real' price?
All of them — it is the same price, just grouped into different sized chunks of time. A 1-hour candle is simply four 15-minute candles squeezed into one.