
Contents
Check 1: which way is the market leaning on the bigger chart?Check 2: mark the prices the market keeps reacting toCheck 3: wait for the level to prove itselfCheck 4: measure what you risk against what you can winWhen the right answer is "no trade today"The four checks in about a minute
Check 1: which way is the market leaning on the bigger chart?
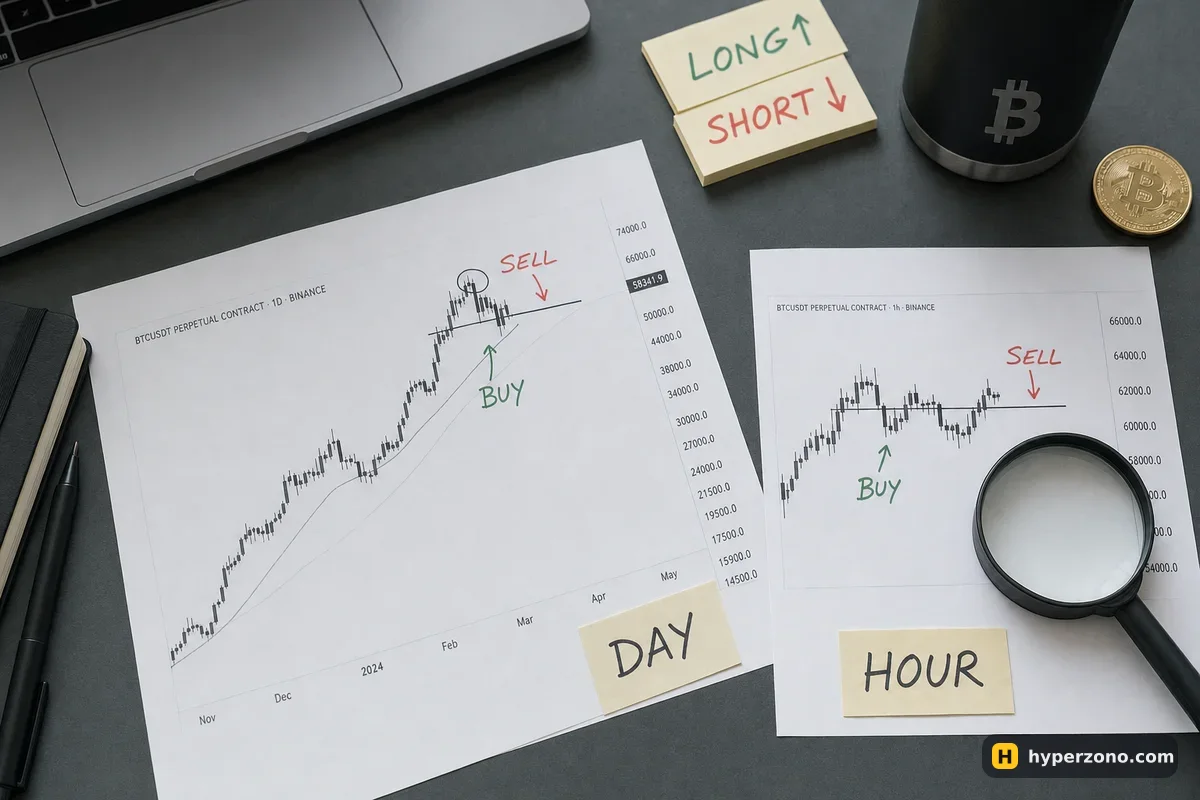
Before you think about an entry price, decide on a direction. Open the daily chart of the coin you want to trade, hold your phone a little further away than usual, and ask one question: over the last few weeks, are the peaks and dips stepping higher, stepping lower, or just bouncing inside the same band?
If they step higher, you look for buys and ignore sell ideas that day. If they step lower, you only look for shorts. If price is going sideways, you either wait or you trade the edges of that band and expect small moves. Picking a direction first removes half the decisions you would otherwise make in a panic.
One honest warning about this check: the bigger chart tells you what has been happening, not what will happen. A trend can end on the day you finally join it. That's why the direction check is only the first filter, and why every trade still needs a stop-loss under it.
Check 2: mark the prices the market keeps reacting to
Now switch the chart from daily to 1 hour — that is the interval most beginners use for entries — and draw two or three horizontal lines, nothing else. You put a line where price turned around clearly, where it stopped falling more than once, or where it broke through and then came back to the same area. These are your levels, and they matter because a lot of other traders are watching the same obvious spots.
You don't need indicators for this, and you don't need twenty lines. Three good ones beat a chart covered in colour. Round numbers often work as levels on their own — a coin can hesitate at 80,000 simply because that is where a lot of orders sit.
The point of marking levels in advance is that it turns a vague feeling into a plan with a price in it. Say bitcoin is trading around 83,000 — the numbers here are just for the example, not a current price. Instead of "bitcoin looks strong", you get "my level is 83,400; if price comes back there and an hourly candle closes above it — a candle is just one bar on the chart, and on the 1-hour chart each one finishes at the top of the hour — I buy at about 83,500". The easiest way to get used to this is to sign up on Bybit, open the chart for BTCUSDT and draw your lines while nothing is happening — just check during sign-up that futures are available where you live, because that varies by country.
Check 3: wait for the level to prove itself
This is the part that separates a trade from a guess. When price arrives at your level, you do nothing yet. You wait for the market to show you a reaction: price touches 83,400, sellers fail to push it lower, and the candle finishes — closes — back above the line. For a short, the mirror image — price pushes into the level from below and gets rejected back down.
Buying straight into a falling price because "it's at my level" is predicting. Buying after the price has already stopped falling there is reacting, and reacting costs you a few dollars of entry price in exchange for far fewer bad trades. In this example that means your entry is around 83,500 rather than 83,400 — and that is money well spent.
Confirmation also gives you something a prediction never gives you: a natural place for your stop. Just below the candle that reacted at the level is where your idea stops being true, so the stop goes there — 83,250 in this example. How to actually place that stop is a two-minute job in the order window.
Check 4: measure what you risk against what you can win
You now have three prices: entry at 83,500, stop at 83,250, and the next level ahead at 84,700 where you would take profit. Subtract and compare. If the distance to your target is at least twice the distance to your stop, the trade is worth taking. If it isn't, you skip it, no matter how good the chart looks.
Here are two setups at the same entry price, using illustrative numbers to keep the arithmetic easy.
| Check | Trade you take | Trade you skip |
|---|---|---|
| Entry after the candle closes | 83,500 | 83,500 |
| Stop below the level | 83,250 | 82,900 |
| Next level ahead | 84,700 | 83,900 |
| Risk vs reward | 250 vs 1,200 — nearly 1:5 | 600 vs 400 — worse than 1:1 |
| Decision | Take it | Walk away |
The second setup can still win. The problem is that one loss there wipes out the gains of several winners. You can be wrong more often than right and still come out ahead, as long as your winning trades bring in more than your losing ones cost you. How many USDT to actually put behind the trade is a separate decision — see working out your position size.
Write the level down before price gets there. On a card or in your notes: "If BTC comes back to 83,400 and an hourly candle closes above it, I buy at about 83,500, stop 83,250, target 84,700." Once the candles start moving, your judgement gets worse, not better — a sentence written in advance is the only thing that protects you from your own excitement.
When the right answer is "no trade today"
Beginners often treat an empty position as money being wasted. It isn't. The market spends most of its time doing nothing readable — drifting in the middle of a range, far from every level, with no clear direction on the daily chart. Opening a trade there is paying fees for a coin flip.
Skip the day when price is nowhere near a level, when the bigger chart and the smaller chart point different ways, when the risk-to-reward comes out below 1:2, or when you have already taken two losses and feel like getting them back. That last one is the expensive one. Three or four honest setups a week is plenty when you are starting.
It also helps to trade only a couple of liquid coins so you actually learn how they behave — which coins to start with is a short read.
The four checks in about a minute
Look at the daily chart
Up, down or sideways? That decides whether you are allowed to buy, to sell, or to do nothing today.
Switch to 1 hour and draw two or three levels
Horizontal lines where price clearly turned before. No more than three, or the chart stops speaking to you.
Wait for price to reach a level and react
You want the candle — one bar on the chart — to finish back off the level in your direction. A touch alone is not a signal.
Compare risk with reward, then open the trade with the stop attached
Entry just past the level, stop just beyond it, target at the next level ahead. If the reward is not at least twice the risk, close the app. If it is, set the stop and the take-profit in the order window at the same time, so you don't have to watch the chart. Just remember the stop is a trigger, not a promise: on a fast move it can fill a bit worse than the price you set — more on that in whether a stop loss really limits your loss.
Run the same four checks for a week on whatever platform you use. You will notice two things: you take far fewer trades than you expected, and the ones you do take are easier to hold, because you knew in advance where you were wrong. Turning this into a written routine is covered in how to write a plan for a single trade.
What is the best indicator to tell me when to buy and sell crypto?
There isn't one, and any indicator that claims to be it is just a repackaged version of the price you can already see. Levels and the direction of the bigger chart will take you further than a screen full of lines. If you want one helper later, a single moving average to confirm direction is enough.
What does "a candle closes" actually mean?
Each bar on the chart covers a fixed slice of time, and it stops changing when that slice ends. On a 1-hour chart a new candle starts at the top of every hour and the previous one is finished, or closed, at that moment. Waiting for the close means waiting until that bar is done, instead of reacting to a price that can still flip back before the hour is up.
Which chart interval should I use for entries?
The 1-hour chart is a comfortable starting point: you get a handful of candles a day to react to, and you are not glued to the screen. Keep the daily chart for direction and the 1-hour for the entry. A 15-minute chart works too, but it asks for more attention and produces more noise.
How long do I wait for confirmation at a level?
Until the candle on your entry chart closes. On a 1-hour chart that is up to an hour of waiting; on a 15-minute chart, at most 15 minutes. If you cannot sit through that, use a smaller chart interval for entries rather than clicking early.
What if the price runs away while I am waiting?
Then you let it go. Chasing a move that has already happened puts your entry far from your stop, which ruins the risk-to-reward of the trade — exactly the thing you were checking for. There is another level, and another day.
Do the same checks work for shorts?
Yes, just mirrored. Lower highs and lower lows on the daily chart, a level above the current price, a rejection back down, stop above the level, target at the next level below. Selling short is the same four checks pointed the other way.