
Contents
Start with three, not with tenEMA 50 and EMA 200: which way the market has been leaningRSI 14: a tiredness gauge, not a buy buttonVolume: does the breakout have anyone behind itWhat the three look like together before one tradeHow to add them to your chartWhat indicators cannot do for you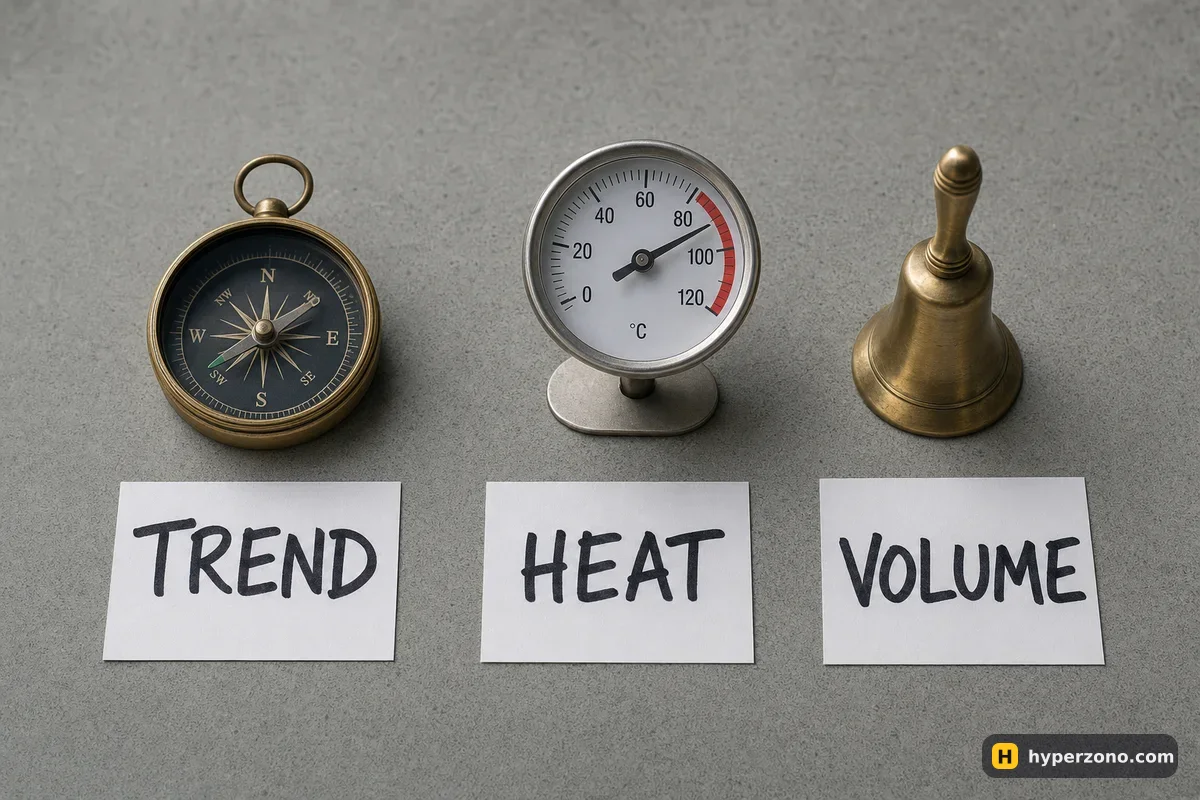
Start with three, not with ten
Open any charting app and you get a list of a couple of hundred indicators with names you have never heard. It is tempting to switch on five or six, because more lines feel like more information. In practice they are mostly the same information painted in different colors — nearly every indicator is built from the same two numbers, price and volume.
With two or three indicators you get a decision; with ten you get an argument you can resolve any way you like. That is the real danger. If one line says buy and another says sell, you will quietly follow the one that agrees with what you already wanted to do, and then call it analysis.
EMA 50 and EMA 200: which way the market has been leaning
An EMA is just an average of the recent closing prices, with the newest candles counted more heavily than the old ones. Add two of them to your chart: one with a length of 50, one with 200. Leave every other setting as it comes.
Reading them is simple. When price is above both lines and the 50 sits above the 200, buyers have had the upper hand recently, and a long fits the background better than a short. When price is below both and the 50 is under the 200, it is the other way round. When the two lines are tangled together and price keeps crossing them, the market has no direction and your odds on either side are poor — that is a fine moment to do nothing.
The length depends on your chart interval. On a 1-hour chart the 50 EMA covers about two days of trading and the 200 EMA a bit over a week, which is a sensible window for a trade you plan to hold for hours. If you are still deciding which interval to look at, that question has its own page about timeframes.
RSI 14: a tiredness gauge, not a buy button
RSI measures how one-sided the recent candles have been, on a scale from 0 to 100. Use the default setting of 14 and the default levels of 30 and 70. You will see it as a wavy line in a small window under the price chart.
Almost every beginner is taught the same wrong rule: buy when RSI drops below 30, sell when it goes above 70. In a strong downtrend RSI can stay under 30 for days while price keeps falling, and everyone who bought because RSI said "oversold" just keeps losing on every new candle. The number tells you the move has been one-sided, not that it is about to turn.
What it is genuinely good for is holding you back. If you have decided to go long and RSI is already at 78 after a long green run, you would be buying from people who are closing their trades with profit. Waiting for the line to cool down toward the middle, or skipping that trade entirely, costs you nothing and saves you from chasing.
Volume: does the breakout have anyone behind it
Volume is the row of bars under the chart. Each bar shows how much was traded during that candle, so a tall bar means a lot of people were active and a short one means almost nobody was.
It earns its place when price pushes through a level it has been stuck under for hours. If that candle comes with a volume bar clearly taller than the recent ones, real money moved and the break has a better chance of holding. If the same break happens on bars no bigger than usual, it very often slides straight back into the old range — and you are left in a trade that looked right for ten minutes.
One honest detail: the volume you see belongs to that one contract on that one exchange, not to the whole bitcoin market. It is still useful, because you are comparing today's bars with yesterday's bars on the same chart. If candles themselves are still new to you, read how to read a candlestick chart first — the indicators make much more sense after that.
What the three look like together before one trade
Say bitcoin is trading around 60,000 — an illustrative number, not a forecast. Price sits above both EMAs and the 50 is above the 200, so the background leans up. RSI is around 55: the move is alive but not stretched. Then price pushes above a level it has been stuck under for three hours, and that candle's volume bar is clearly taller than the ones before it.
That is the kind of moment your three indicators agree on. You open a long, put the stop just under the low of the last few hours, and take a size you picked before you ever opened the chart — so if price comes back through that low, the loss is an amount you already accepted, not a surprise. The indicators did not tell you any of that; they only told you the moment was worth acting on.
Now change one detail. If RSI had been at 79 after a long green run, or the breakout candle had come on a volume bar no bigger than the quiet ones before it, you would simply skip it and wait. Most of the time the honest answer from three indicators is "not now", and skipping those trades is exactly how a small account survives its first month.
| Indicator | Setting | What it actually shows | What it cannot do |
|---|---|---|---|
| EMA 50 and EMA 200 | Lengths 50 and 200, on closing price | The direction price has been moving over the last days | Tell you where the move ends |
| RSI | Length 14, levels 30 and 70 | How stretched and one-sided the recent candles are | Call a reversal; it can sit below 30 for days |
| Volume | Default, no settings | How many people traded during each candle | Show you who traded, or why |
How to add them to your chart
Open the chart of the contract you want to watch
Use the full chart view rather than the small preview. On a phone, turn the screen sideways — the chart gets the whole screen and the indicator windows become readable.
Find the indicator list
Look for the button that opens the list of indicators, usually marked with an fx symbol or simply called Indicators, at the top of the chart.
Add the first EMA
Search for EMA or Moving Average Exponential, add it, then open its settings and set the length to 50.
Add the second one
Add EMA again and set the length to 200. Give the two lines different colors so you can tell at a glance which is which.
Add RSI and check volume
Search for RSI, add it and leave the length at 14. Volume is switched on by default on most charts; if the bars are missing, search for Volume in the same list.
The chart in an exchange app and the chart on TradingView look and behave almost the same way here, so whatever you learn on one carries over. The quickest way to see it is to sign up on Bybit, check during sign-up that futures are available where you live, then switch to demo mode, open a contract that is there — bitcoin or ethereum is the easy choice — and spend ten minutes putting these three on the chart. Nothing is at risk while you are clicking around.

No line on the chart protects your money. A stop-loss does. Decide where you are wrong and place the order before you enter, every single time — here is how to set a stop loss in the order window.
What indicators cannot do for you
All three are late by design. A 200 EMA is an average of the last 200 candles, RSI counts gains and losses that have already printed, and volume counts trades that already happened. None of them can be early, and any tool that promises to be early is usually the same math with a shorter setting, which makes it noisier rather than smarter. That is fine as long as you use them to get a quick, consistent read instead of deciding by feel — the trap is tweaking the settings until the line would have caught last week's move perfectly, because it will catch the past beautifully and tell you nothing about tomorrow.
They also stay silent on everything that decides whether your account grows: how much of your 100 USDT goes into the trade, where exactly the stop sits, what you do when a piece of news moves the price 3% in a minute. Those answers come from your plan for the single trade, written before you open the chart. Indicators choose the moment; your plan chooses the money.
And a set of three lines is not a strategy by itself. A strategy says when you enter, how much you risk, and when you get out — if you want a complete simple approach that uses exactly this set, read which strategy suits a beginner.
How do I combine three indicators into one decision?
Look at them in order: direction first, then how stretched the move is, then who was involved. Price above both EMAs with the 50 above the 200, RSI somewhere in the middle, and a breakout candle on clearly bigger volume is the moment they agree. If any one of the three is against you, the trade waits.
Which RSI settings should I use on a 15-minute or 1-hour chart?
Leave it at 14 with levels of 30 and 70, whatever interval you use. Shorter settings make the line jump around and produce more signals, not better ones. Changing the number because last week's setting did not work is how people end up with an indicator fitted perfectly to the past.
Should I buy when RSI drops below 30?
No, not on its own. RSI below 30 means selling has been one-sided, and in a real downtrend it can stay there for days while price keeps falling. Treat it as a warning that the move is stretched, then look at where price sits relative to your EMAs before you decide anything.
Do indicators work differently on futures than on spot?
The chart math is identical — same candles, same averages. What changes is the cost of being wrong: with leverage, a move that would be a small loss on spot can close your position. So on futures the stop-loss matters far more than the indicator does.
What about MACD, Bollinger Bands or Ichimoku?
They are not bad tools, they are just more of the same raw material: price and volume, processed differently. Learn to read your three properly over a few dozen trades first. If you later feel one of them answers a question your set does not, add it then — one at a time.
Can I skip indicators and follow signals from a channel instead?
You can, but then someone else decides your entry, your size and your exit, and you have no way to tell a good run from luck. That tradeoff deserves its own look — see ready-made Telegram signals before you pay for any of them.