
Contents
What one candle actually tells youLong wicks and fat bodies: what they are telling youThe same chart looks different on 5 minutes and 4 hoursWhy a pattern only means something at a levelFive candlestick patterns that are genuinely usefulHow to use this before your first trade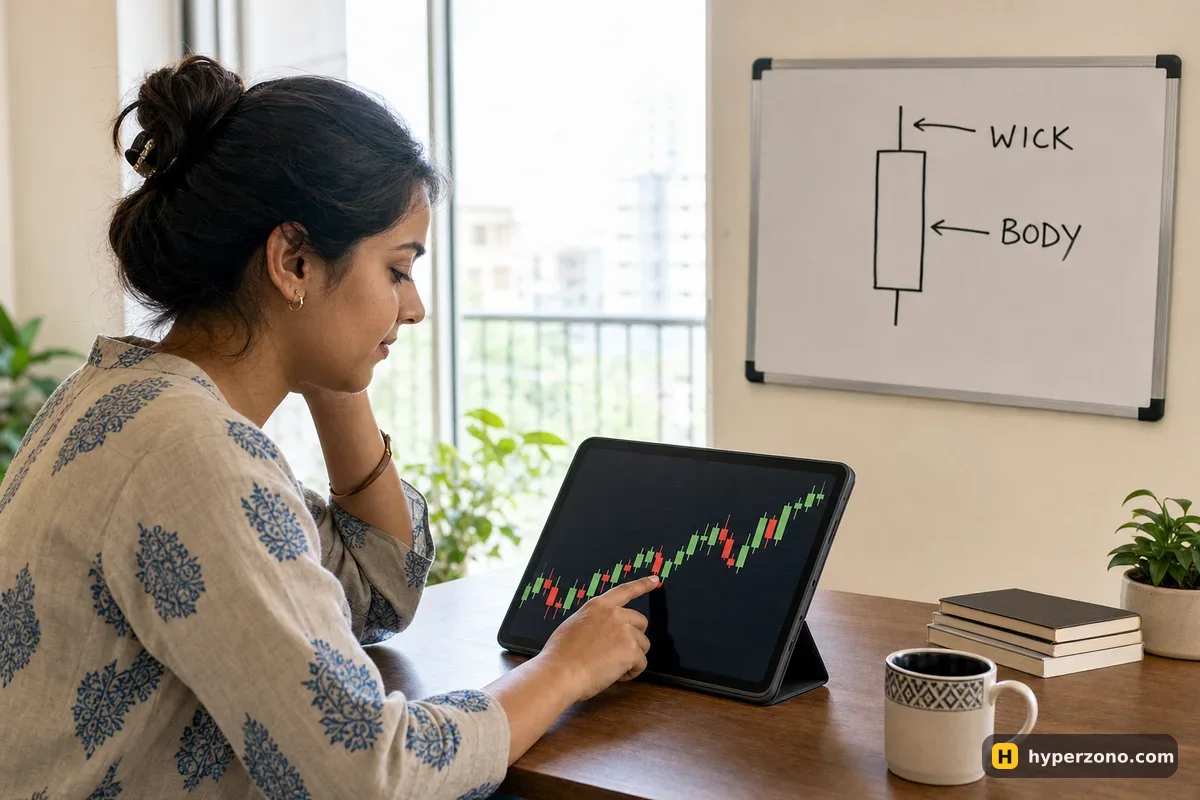
What one candle actually tells you
Open a bitcoin chart on any exchange and you see rows of small green and red blocks with thin lines sticking out of them. Each block is one candle, and each candle covers one hour, one day, one minute — whatever interval you picked. Inside that stretch of time, the candle records four prices.
- Open — the price at the moment the candle started.
- Close — the price at the moment it ended.
- High — the highest price reached inside that time.
- Low — the lowest price reached inside that time.
The thick part is the body, drawn between the open and the close. Green means the close was above the open, so price finished higher than it started; red means the opposite. The thin lines above and below are the wicks (some people call them shadows), and they show how far price traveled outside the body before coming back.
Here is a made-up hourly candle to make it concrete. Bitcoin starts the hour at 100,000, climbs to 101,200, slides down to 99,200 and finishes the hour at 100,800. The body sits between 100,000 and 100,800 and is green, a short wick pokes up 400 dollars to 101,200, and a longer one hangs 800 dollars down to 99,200. From one small shape you now know that buyers won that hour, but only after sellers dragged price 800 dollars below the open and failed to hold it there.
Long wicks and fat bodies: what they are telling you
A big body with barely any wicks means one side was in control from the first second to the last. Price opened, moved in one direction and closed near the extreme. Three or four of those in a row, all the same color, and you are looking at a market that is genuinely moving, not drifting.
A long wick tells the opposite story: price went there, and the market refused to stay. A candle that spikes 2% down and then closes back near its open means sellers pushed hard and buyers bought every bit of it back within the hour. That rejected price is information — it is where somebody with real money showed up.
A small body with wicks on both sides means neither side got anywhere. On its own that is just a quiet hour and tells you very little. At a price the market has respected before, the same small candle becomes a hint that the current push has run out of strength.
The same chart looks different on 5 minutes and 4 hours
Switch the same chart from 5 minutes to 4 hours and the market looks like a different market. On the 5-minute chart every tiny wobble becomes its own dramatic candle; on the 4-hour chart that whole hour of panic shrinks into one small wick. Nothing changed except how much time each block covers.
For reading structure before a first trade, the 1-hour chart is a comfortable place to start: slow enough that each candle means something, fast enough that you are not waiting days. Which interval suits your schedule and your style is a separate question, covered in what a timeframe is and which chart interval to use. The quickest way to feel the difference is to do it yourself: open a Binance Futures account — check during sign-up that futures are available where you live — load the BTCUSDT chart and tap through 5m, 1h and 4h on the same day.
Why a pattern only means something at a level
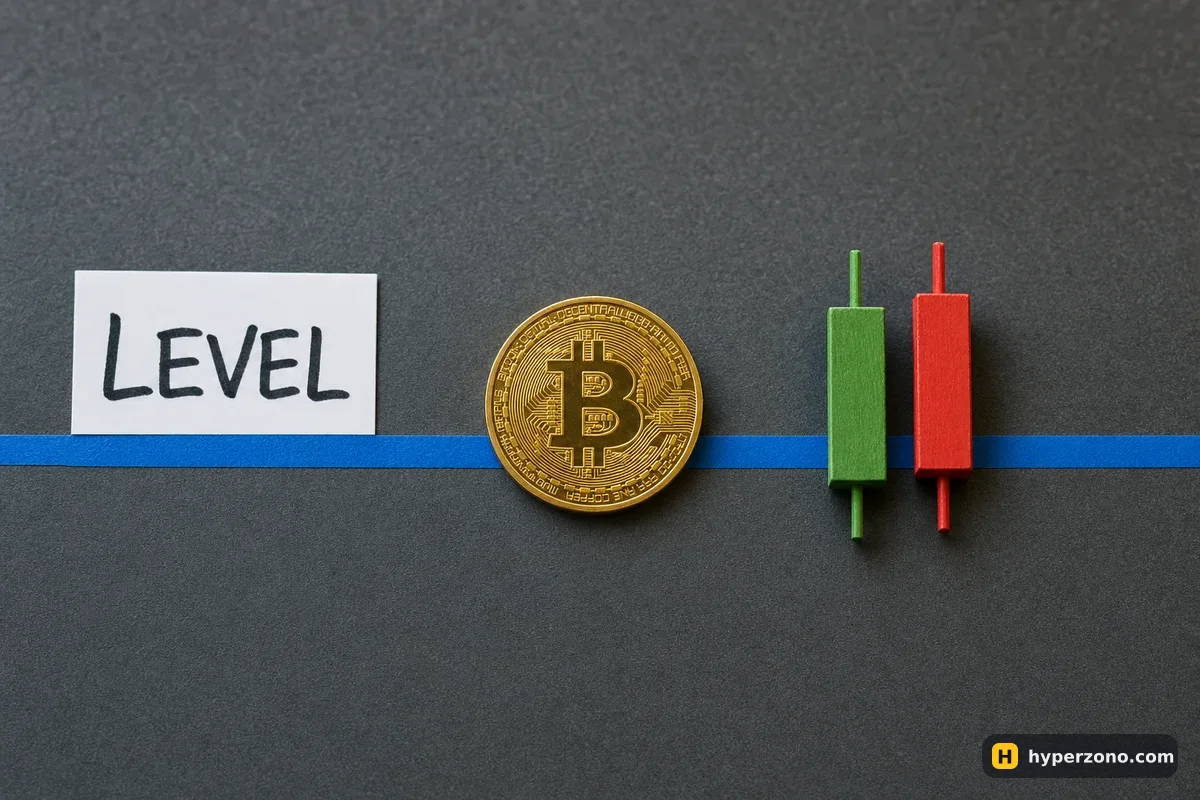
Before you hunt for shapes, mark the lines. A level is simply a price where the chart clearly turned before — a high it could not break two or three times, or a low where buying appeared each time it got there. Draw two or three horizontal lines through those spots and most of the chart suddenly makes sense.
The two kinds have names you will hear everywhere, so take them now and be done with it. A line below the current price, where buying keeps showing up and price keeps bouncing, is called support; a line above, where price keeps getting stopped and pushed back down, is resistance. Same thing, just which side of price it sits on.
A candlestick pattern is worth your attention only when it forms at one of those prices. A perfect hammer halfway between support and resistance is just an hour where price wobbled and came back; the same hammer right on a level the market has bounced from twice this week is a real signal that buyers defended it again. Same shape, completely different meaning.
Five candlestick patterns that are genuinely useful
There are lists online with fifty named patterns, most of which you will never use. These five cover almost everything a beginner needs, and all of them assume you are looking at a level, not at empty chart space.
Say the last hour was red, and then the next candle not only erases it but closes above where that red one opened. Its body completely covers the previous body in the opposite direction, and that is what people call an engulfing candle. Right at support it means buyers took back the whole previous hour in a single hour, and the bigger the body doing the swallowing, the louder it speaks.
You will also see candles with a tiny body and one long wick hanging off it — people call them pin bars, hammers or shooting stars, depending on which way the wick points. The long wick points at the price the market tried and rejected. A down-pointing wick at support, or an up-pointing wick at resistance, is the market telling you it went there and did not like it.
Sometimes a candle fits entirely inside the previous candle's range, high and low included. Nothing broke out in either direction — the market squeezed and nobody committed. That shape is an inside bar, and it works better as a "get ready" than as an entry: whichever side the next candle breaks out of that range often sets the direction for the next few hours.
Then there are candles that open and close at almost exactly the same price, leaving a thin line with wicks on both sides. That is a doji. In the middle of a move it is noise; after a long run straight into a level, it says the push just ran out of fuel and the two sides are now even.
Price has been bumping into the same line for hours, and then one big-bodied candle closes clearly beyond it — a breakout candle. The trap here is the false break: price pokes through, everybody jumps in, and the candle closes back inside the old range. Waiting for the close is what separates a real breakout from a trap.
Judge a candle only once it has closed. A candle that looks like a perfect hammer forty minutes into the hour can finish as a plain red block. Until the interval ends, the shape can still change completely. Waiting an hour for a candle to finish feels long the first few times. Close the app and come back — the candle will still be there, and you will see the real shape instead of a half-formed one.
How to use this before your first trade
Pick one coin and one interval
Open the chart of a big coin that lots of people trade — bitcoin or ethereum — and set it to 1 hour. Reading one chart well beats flicking between twenty. If you are unsure what to watch, start with the coins most beginners trade first.
Mark two or three levels
Scroll back a week or two and draw horizontal lines at the prices where the chart clearly turned. On the phone, open the chart full screen — there is a drawing tool icon next to it, and the horizontal line is one of the first options. If you can't find it, a screenshot with lines drawn in your photo app works just as well for practice. You should end up with a small number of obvious lines, not a spider web.
Wait for price to reach a line
Nothing to do in between. Most of the chart is price traveling between your lines, and that is exactly where candle shapes mean the least.
Read the candle that closes there
Engulfing, pin bar, doji, inside bar, breakout — or none of them, which is also an answer. Turning that read into an actual buy or sell decision is the next step, covered in how to know when to buy and when to sell.
Decide your exit before you click
Pick the price where you would admit you were wrong — usually just beyond the wick of the signal candle — and set it as a stop loss when you open the trade. Writing the whole thing down first is what a trade plan is for.
Run it with no money at risk first
Read ten setups in demo mode before you risk real USDT. A demo futures account on Bybit shows the same chart and the same order window, so the reading practice carries over.
You do not need a single indicator to do any of this — candles and levels are the raw price, and everything else is calculated from them. When you get curious later, which indicators a beginner actually needs keeps that list short too.
What do green and red candles mean in trading?
Green means the candle closed higher than it opened, red means it closed lower. The color says nothing about whether price is above or below yesterday — only about that one candle. Most apps let you change the colors in chart settings, so check which is which before you rely on them.
What is the difference between support and resistance?
Both are just lines you draw at prices where the chart turned before. Support sits below the current price, where buyers kept showing up and lifting it back. Resistance sits above, where sellers kept stopping the move. When price breaks through one, it often starts acting as the other kind on the way back.
Which timeframe should a beginner use to read candlesticks?
The 1-hour chart is a reasonable starting point: each candle has enough weight to mean something, and you are not glued to the screen. The 1-minute and 5-minute charts look exciting but are mostly noise for someone learning. There is more on choosing your interval on the timeframe page.
Do candlestick patterns actually work in crypto?
They describe what buyers and sellers just did, so they work the same way in crypto as anywhere else — but they are hints, not predictions. The same pattern can fail three times in a row. That is why you decide your exit price before you enter, instead of trusting the shape.
How many candlestick patterns do I need to learn?
Four or five is plenty: engulfing, pin bar, inside bar, doji and the breakout candle. Learning fifty names does not make you a better trader, and it mostly makes you see signals in places where there are none.
Why does my candle keep changing shape?
Because it has not closed yet. The last candle on the right updates live until its interval ends, so its body and wicks move with every trade. Read patterns on candles that are finished, and treat the live one as a work in progress.