Contents
Why your line always seems to agree with youPick the two points before you see what came nextAn acceptable line next to a stretched oneThe real test: could someone else draw it?Re-check after the next candle, without touching the pointsWhat to do when your lines keep failingPractise where a wrong line costs nothing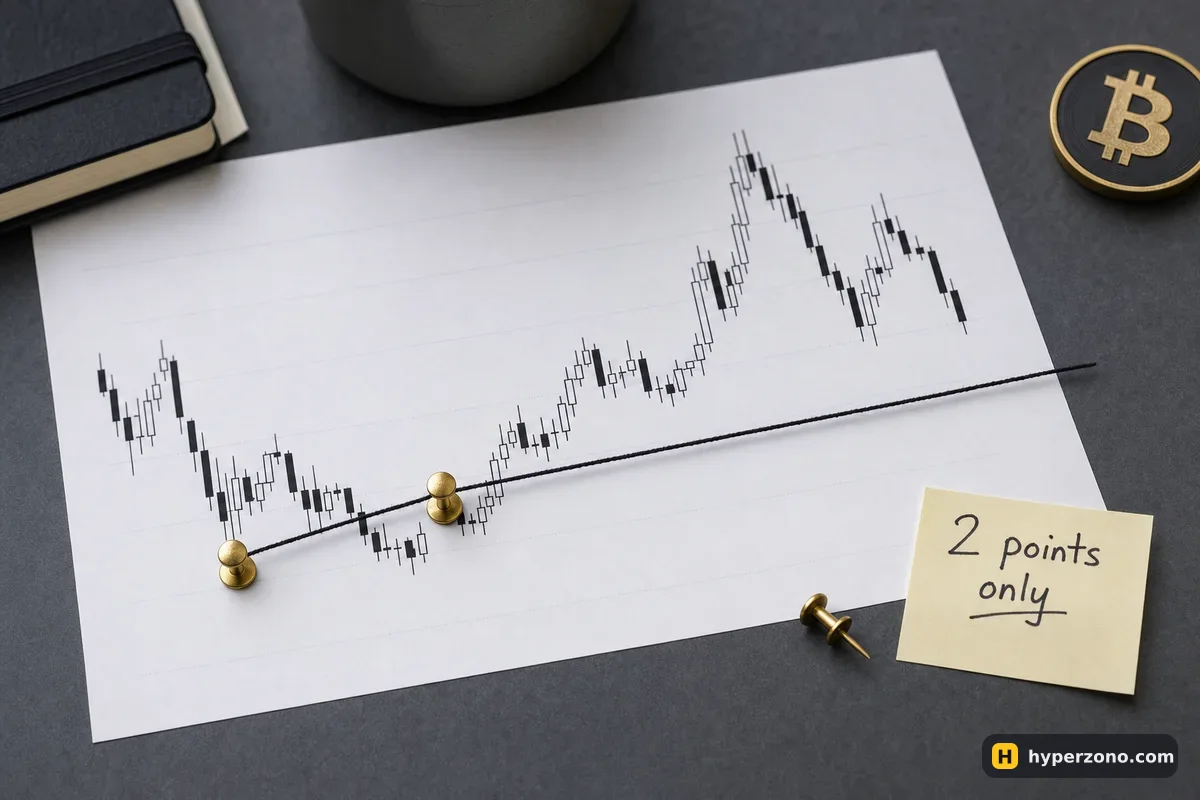
Why your line always seems to agree with you
The chart is already finished when you open it. You can see which way price went, so your eye goes hunting for the two lows that make the move look obvious and your trade look smart. Nothing dishonest happens while you drag the cursor — the problem is the order of events: you decided what you hoped for, then found geometry that matched it.
So the fix is also about order, not about talent. You choose the anchor points first, you record them in words and numbers, and you let the line stand or fall on its own. Reading direction from a sequence of higher lows or lower highs is a separate skill, and the page on how to tell when to buy and sell covers that part; here we only deal with the sloping line itself and whether anyone else could draw the same one.
Pick the two points before you see what came next
A trend line needs swing points, not any random candle. A swing low is a low with higher lows on each side of it — usually a couple of candles either side is enough for you to see it clearly. For a rising line you connect two swing lows; for a falling line, two swing highs. Everything else on the chart is noise for this purpose.
The trick that removes most of the self-deception is simple: hide the right-hand side of the chart before you choose. On a computer you can scroll the chart back so the recent candles sit off screen; on a phone, take a screenshot and cover the last third with a piece of paper or your hand. You are allowed to see only the candles that existed when the second anchor point formed. Then write the two points down as plain text — for example "4-hour low, 101,200" and "4-hour low, 103,400" (made-up numbers, just to show the format).
Fix the chart and the scale
Choose one timeframe and stay on it — a 4-hour chart is a comfortable starting point because swings are visible without constant watching. Charts can also show price on a normal scale or on a squeezed one, where the same percentage move always takes the same height (your chart settings call them linear and log). Pick one and leave it alone, because the same two points give you a different slope on each.
Hide what happened after
Scroll the chart back or cover the last candles. You should not be able to see the outcome you are hoping to confirm.
Mark the two swing points
Put a small mark or note on each one and write its time and price in a note on your phone. Two points, no more.
Decide wicks or bodies once
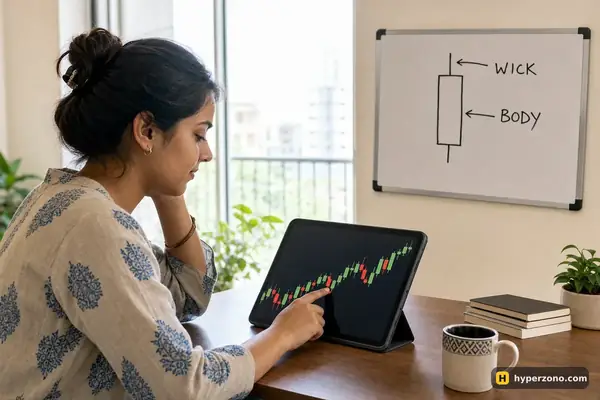
Either you always touch the lowest wick, or you always touch the candle body. Pick one and keep it for the whole chart, because the two conventions give you visibly different lines on the same candles.
Write down what would prove the line wrong
One sentence in the same note, before you uncover anything: "this line is dead if two 4-hour candles close below it." Numbers and words, not feelings. This sentence belongs in your plan for the trade; on the rest of this page we'll just call it your break rule.
Uncover the rest of the chart
Now scroll forward and see what price actually did with your line. Whatever you see, do not move the two points.
An acceptable line next to a stretched one
Here is the comparison that makes this concrete. Take one chart and draw two candidate lines on it: Line A through the two swing lows you picked blind, and Line B through the two lows you would have picked knowing the outcome — usually the pair that gives a shallower, friendlier slope. Then score both of them on the same questions.
| Question to ask the line | Line A (picked blind) | Line B (picked after the fact) |
|---|---|---|
| How many points did you use? | Two swing lows, recorded before | Two lows, found by looking for the result you wanted |
| Did you move a point to make it touch? | No | Yes — one point slid down a little |
| How many candles closed right through it? | None before the break you wrote down | Three, and you decided those "don't count" |
| Could you state it in two coordinates? | Yes, they are in your note | Not really — you would have to re-find them by eye |
| Would a friend get the same slope? | Likely, from the same two lows | Unlikely |
Notice that none of these questions asks whether the line looks good. A stretched line is almost always the better-looking one, because you tuned it until it was. What separates the two is whether the line can be written down and handed over.
A line you had to move is a different line. If you drag an anchor point to make a third low touch, you have not improved your line — you have deleted one line and created another, and the new one has no history and no test behind it. Save the old one as a screenshot and let the new one start from zero.
The real test: could someone else draw it?
The only check that doesn't depend on your mood is simple: could someone else draw the same line from your two points? There are two ways to run it, and both take a couple of minutes. First, send your two coordinates to someone — a friend, a study partner, even a message to yourself — with no screenshot attached. If everything they need is "4-hour chart, low at 101,200 and low at 103,400, connected through the wicks", the line lives in those numbers and anyone can check it. If the only way to explain it is "you'll see it, it's obvious", then nobody else can check your line — and neither can you tomorrow.
Second, delete your drawings and redraw tomorrow from a clean chart without looking at yesterday's version. Then compare the two screenshots. If you pick the same two swing lows and the slope is close, keep the line. If tomorrow's version is noticeably flatter or steeper, you are not reading the chart, you are redecorating it — and a line that changes shape every day cannot carry a stop-loss or a target.
Doing this once a week with a small note file is enough. Three columns: the two coordinates, your break rule, and what actually happened. After ten lines you'll see your own habit — for example, whether your rising lines always come out a little flatter when you are already long.
Re-check after the next candle, without touching the points
Once the line exists, each new candle gives you one of three answers, and your job is just to read which one came. Price reaches the line and turns away from it — that is a touch, and you can record it as evidence that other people see the same level. Price closes through the line in the way you wrote down — the line is finished, and that is the moment the sentence you wrote does its job: you close, because you decided in advance. Or price simply drifts far away from the line and never comes back, in which case the line is neither right nor wrong, it has just stopped telling you anything and can go.
The dangerous version is the quiet one. Price breaks the line, you feel uncomfortable, and a minute later you have a fresh line drawn to the newest low so the trend "is still intact". The trade survives on screen while your actual risk keeps growing. If price pokes through and comes straight back inside, treat that as a new question with its own checks — not as permission to re-draw the old line.
And a line never sets your trade size for you. Where the line sits tells you where your idea stops making sense; what you risk if it stops making sense is a separate decision, which is what a stop loss is for. A good line with a careless size still empties an account.
What to do when your lines keep failing
Sometimes the honest answer is that this chart does not have a usable sloping line right now, and the best move is to draw fewer of them. Try a hard limit: one rising line and one falling line per chart, nothing more. If you need a third anchor point to make the shape work, delete the line instead and look at flat levels — a horizontal level only needs one number, so it is much easier to write down and repeat tomorrow.
Lower timeframes make the whole problem worse. On a 5-minute chart you can find a plausible line almost anywhere, which feels productive and means almost nothing, because the next two candles redraw the picture. Start on 4-hour or daily candles where a swing low takes real effort to form, and come down only once your weekly redraw test keeps giving the same slope.
Practise where a wrong line costs nothing
All of this is much easier to feel on a live chart than to read about, and you do not need real money for it. A demo futures account gives you the same chart, the same drawing tools and the same order window, so you can mark your two swing lows, write your break rule, place a practice trade and watch what happens to your line over the next day. Open a Bybit demo account and run five lines through the full routine: hide the right side, record two coordinates, draw, write the break rule, then come back tomorrow and redraw from scratch.
If you want the sign-up and demo steps spelled out, the walkthrough for a demo futures account on Bybit has them. One thing to check as you go: an exchange and its futures products are not available everywhere, so confirm during sign-up that they are offered where you live, and treat demo results as practice — the chart is real, the pressure of your own money is not.
How many touches does a trend line need to be valid?
There is no official number — nobody sets the rules for sloping lines, which is exactly why they are so easy to bend. What matters is that you pick your own convention, write it down and keep it: for example, two anchor points to create the line and any later touch counted as evidence. The convention itself is less important than never changing it in the middle of a trade.
Should I draw from the wicks or from the candle closes?
Either works, as long as you use the same one across the whole chart. Wicks give you lines that sit further out and get touched more often; closes give you lines that get broken more cleanly. Mixing the two inside one chart is how people end up with a line that fits everything and predicts nothing.
My line broke by a tiny amount and then price went back up. Was the line right after all?
The rule you wrote decides that, not the outcome. If your rule said "two candles close below" and only one wick poked through, the line survives by your own standard. If the rule said "any close below", then the line is done, even though the next move went your way — one lucky escape is not a reason to loosen the rule afterwards.
Is a trend line enough on its own to open a futures trade?
No. A line tells you where your idea stops working, which is useful for placing a stop and for planning. The direction, the size of the position and the exit still need their own decisions, and plenty of lines that look perfect never get touched again.
Why does my line look different on the phone than on my laptop?
Usually because the visible price range and the chart scale are different. The same two swing lows produce a visually flatter or steeper line depending on how tall and wide the chart window is, and on whether you are on the normal price scale or the squeezed one (linear or log in the settings). The two recorded coordinates stay the same, which is another reason to trust the numbers in your note rather than the picture on the screen.
How do I know I'm not just seeing what I want to see?
Run the redraw test for a week. Delete the drawings each evening, redraw from a clean chart the next day, and compare the slopes. If your lines drift in one direction — flatter under your longs, flatter above your shorts — that is your bias, measured in your own screenshots, and it is far more useful than any opinion about the chart.